Editor's Pick
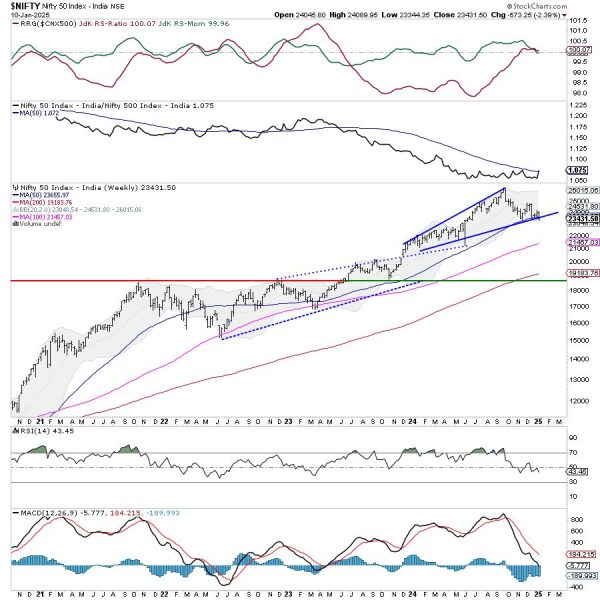
The markets extended their decline over the past five sessions and ended the week on a negative note. While the week started on a...

Hi, what are you looking for?

Asian stocks dip ahead of US jobs data: Nikkei extends decline to 3rd day

Microsoft, Google, Boeing join donors list for Trump’s record $170M inauguration fund

Australia calls Meta’s fact-checking decision a threat to democracy

Elon Musk explores moves to unseat Starmer before next UK elections, FT reports
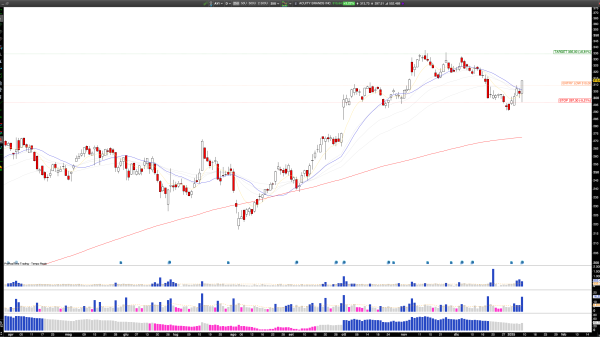
Long AYI: Acuity Brands Q1 Earnings Spark Bullish Momentum, Targeting Recent Highs
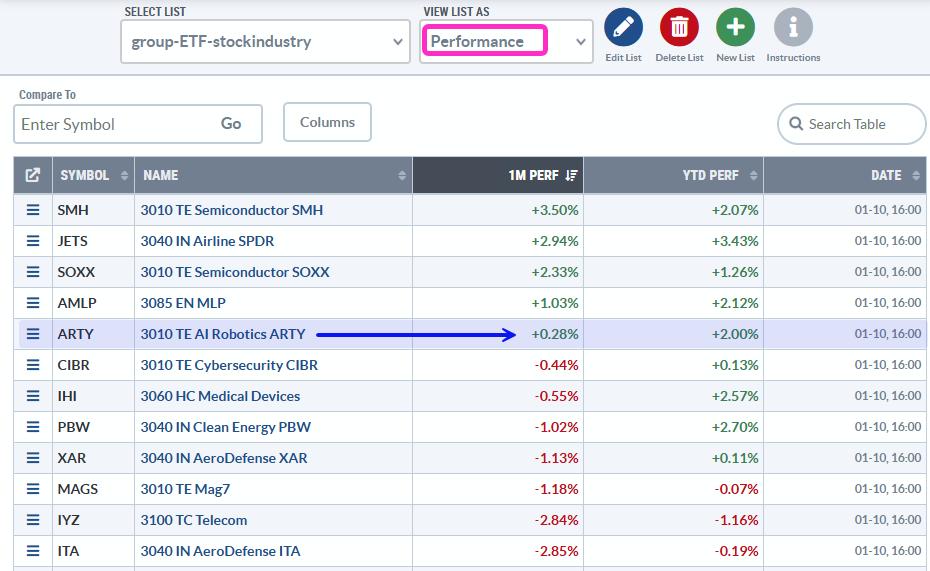
Market Pullbacks Provide Opportunities to Build your WatchList – Here’s How
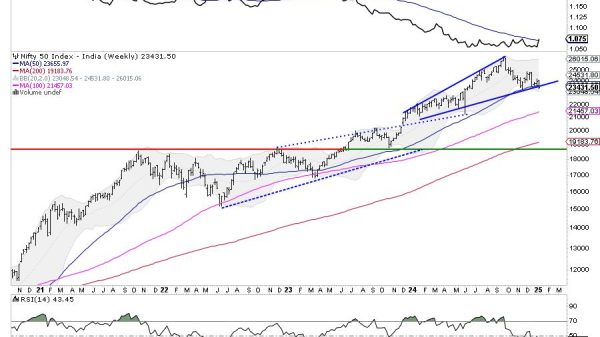
Week Ahead: NIFTY Steps Into Next Week With These Two Negative Technical Developments
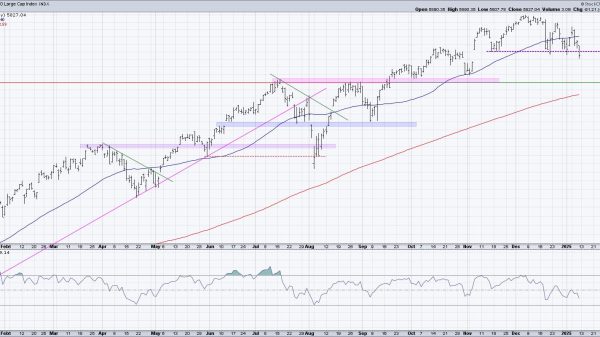
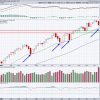
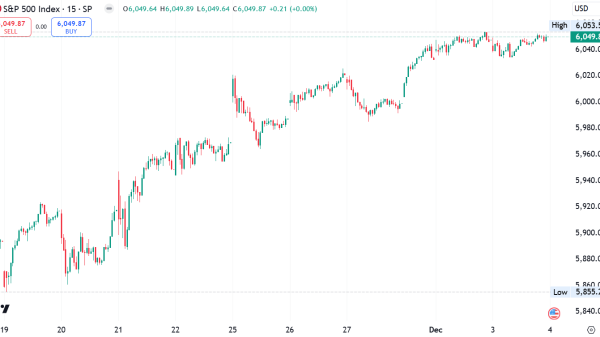
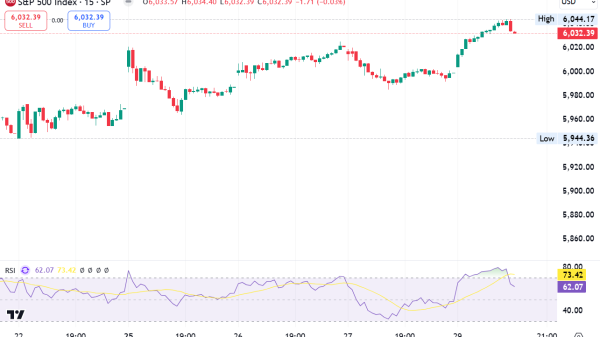
S&P 500 Breakdown Alert! Downside Targets Explained

Stock Market Panic: Why Strong Jobs and Inflation Signal Trouble Ahead
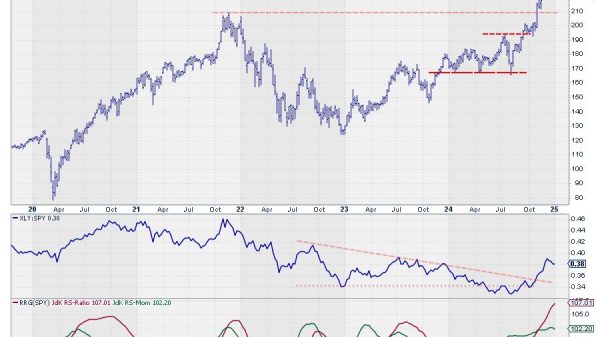
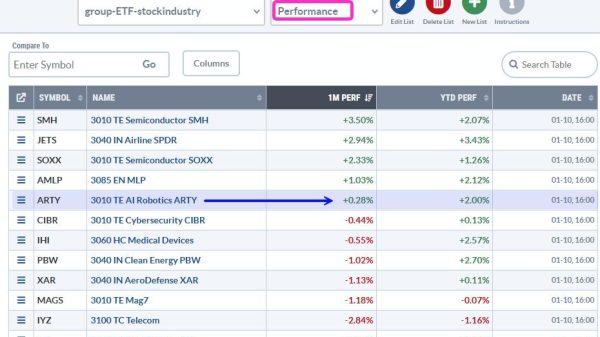
The Best Five Sectors, #2

Meta announces end of its DEI programs. Read the memo.

Vince McMahon settles with SEC over hush money agreements as civil assault case continues
Disney, Fox, Warner Bros. Discovery call off Venu sports streaming service
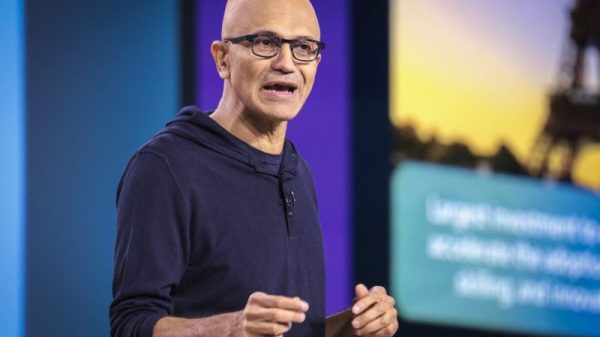
Microsoft confirms performance-based job cuts across departments

Disney says about 157 million global users are streaming content with ads

Don’t worry. There is a common sense response to the surgeon general’s alcohol and cancer warning
Biden admin slammed for ‘waiting’ to declare genocide in Sudan
Trump fills latest Cabinet spots as Jan. 20 inauguration nears
Tulsi Gabbard changes tune on controversial intelligence tool following GOP lobbying
DOGE reps launch meetings with federal staffers in effort to cut government waste: report
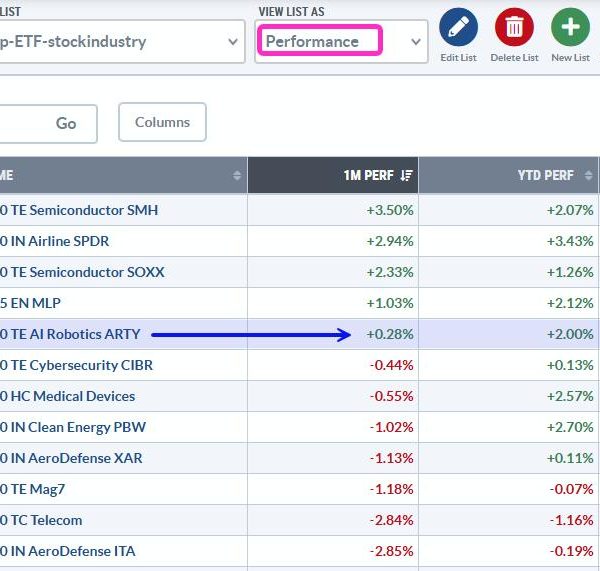
The stock market is in pullback mode with the S&P 500 EW ETF down 5.15% over the past month and down 1% year-to-date. This...
The markets extended their decline over the past five sessions and ended the week on a negative note. While the week started on a...
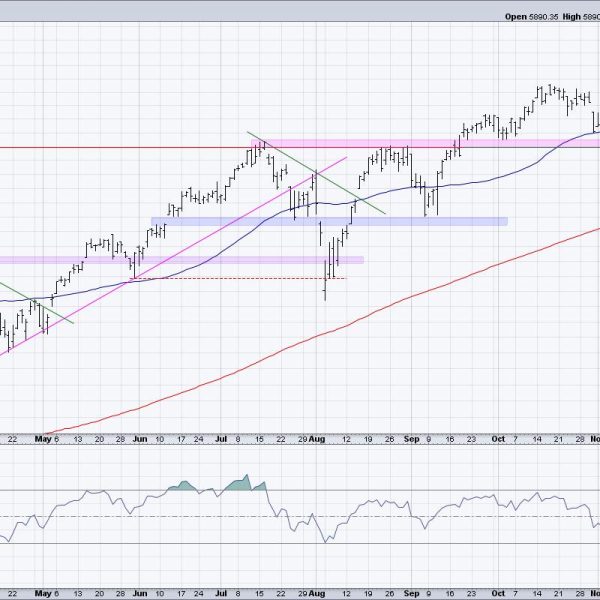
S&P 5850 has been the most important “line in the sand” for stocks since the pullback from the 6000 level in November 2024. With the...


In this edition of StockCharts TV‘s The Final Bar, Dave digs into The Final Bar Mailbag and answers questions on price patterns like bull flags, what...


Costco (COST) stock has soared into uncharted heights, leaving its last all-time record in the dust. With a little under a month before the...


In this episode of StockCharts TV‘s The MEM Edge, Mary Ellen reviews why the markets continue to hit new highs while also highlighting which areas are...
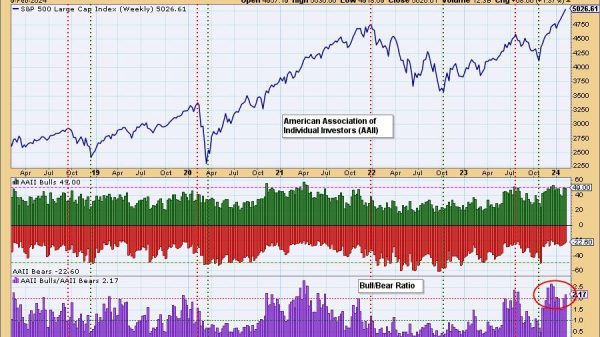
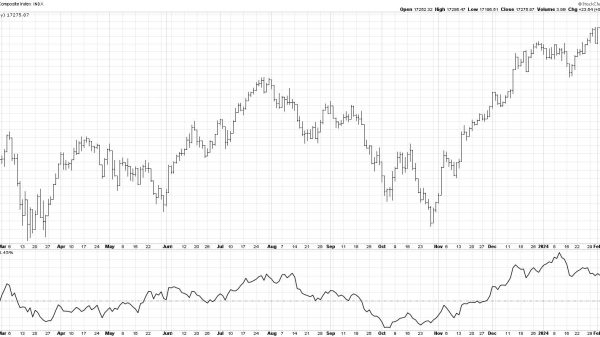
Periodically, we like to review sentiment charts, and today we have two for you. One is the poll results from the American Association of...
The S&P 500 shall heretofore be known as an index that has broken the incredible 5,000 level. That alone is a pretty amazing milestone for...

In this edition of StockCharts TV‘s The Final Bar, Dave welcomes Danielle Shay of Simpler Trading. Danielle highlights three earnings plays she’s focused on this week,...
Note to the reader: This is the seventh in a series of articles I’m publishing here taken from my book, “Investing with the Trend.”...

On this week’s edition of Stock Talk with Joe Rabil, Joe discusses how he uses the price swings and Fibonacci grid to determine the...

In this edition of StockCharts TV‘s The Final Bar, Dave welcomes Ryan Redfern, ChFC, CMT of Shadowridge Asset Management and President of NAAIM. Ryan provides a...


On this episode of StockCharts TV’s Sector Spotlight, I review the monthly charts for January 2024, in combination with the Relative Rotation on the Monthly...