


Editor's Pick
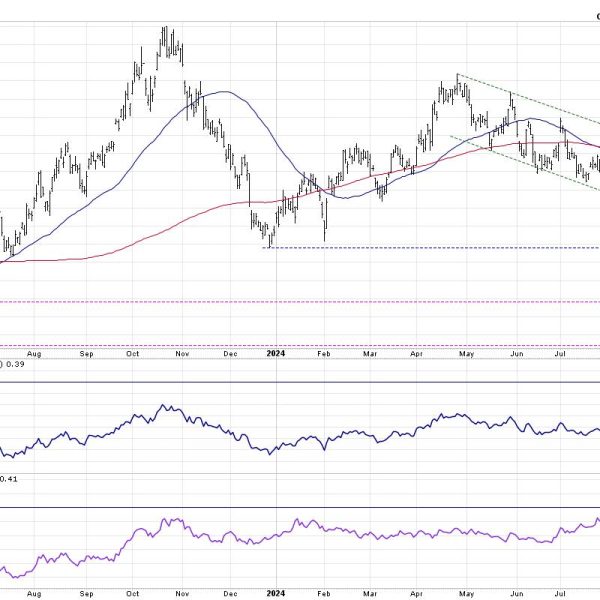
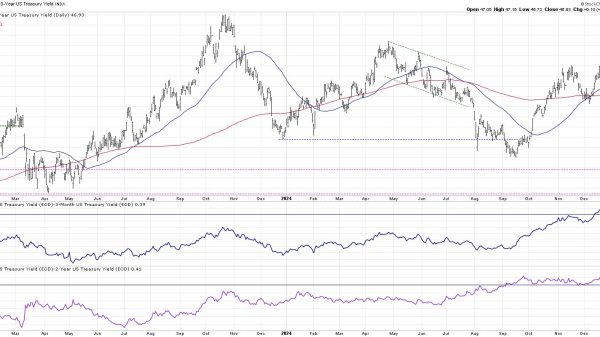
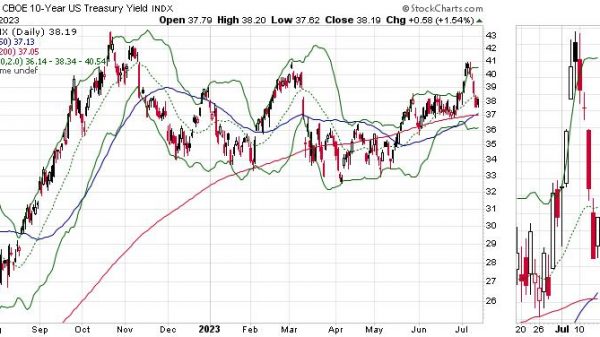
The 10-Year Treasury Yield has gone up a full percentage point, from a low of 3.6% in September 2024 to a level of 4.6%...

Hi, what are you looking for?

Asian stocks dip ahead of US jobs data: Nikkei extends decline to 3rd day

Microsoft, Google, Boeing join donors list for Trump’s record $170M inauguration fund

Australia calls Meta’s fact-checking decision a threat to democracy

Elon Musk explores moves to unseat Starmer before next UK elections, FT reports
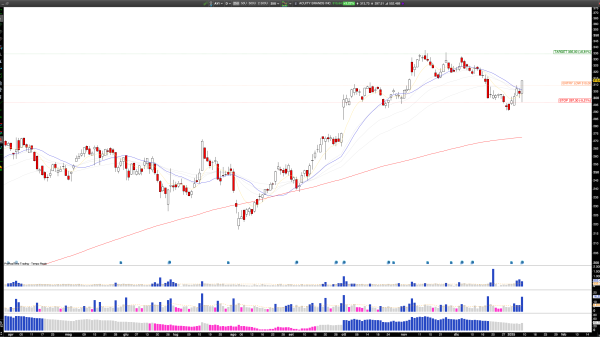
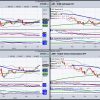
Long AYI: Acuity Brands Q1 Earnings Spark Bullish Momentum, Targeting Recent Highs

Dockworkers union, port companies reach tentative 6-year deal

Tariff threat looms over the year’s biggest electronics show

Nvidia’s Jensen Huang is ‘dead wrong’ about quantum computers, D-Wave CEO says

Panera Brands CEO steps down; CFO to fill in as interim chief

U.S. Steel CEO appeals to Trump after Biden blocks deal with Japanese firm


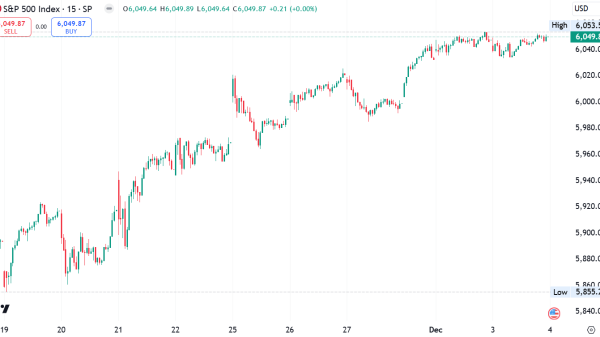
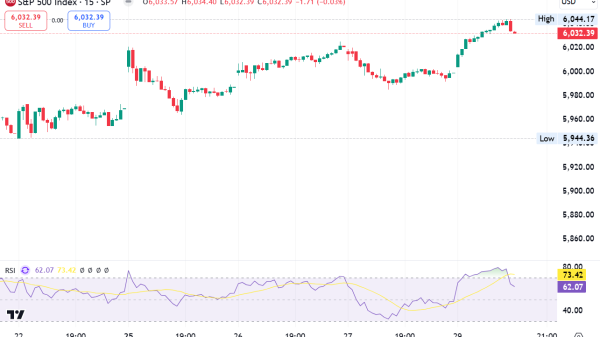
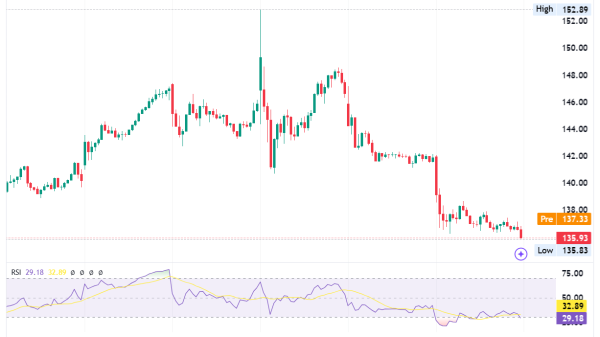
The market sometimes struggles to find direction, as it digests mixed yet impactful economic data. Wednesday was one of those days. With US 10-Year...
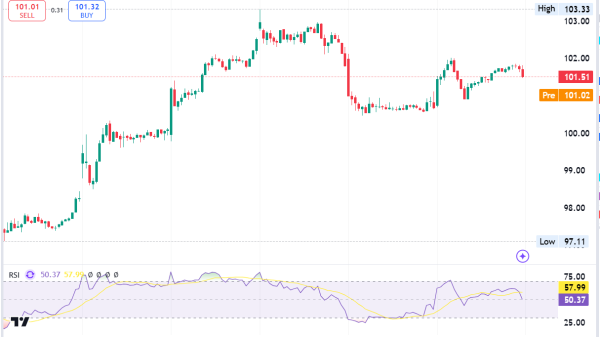
The 10-Year Treasury Yield has gone up a full percentage point, from a low of 3.6% in September 2024 to a level of 4.6%...

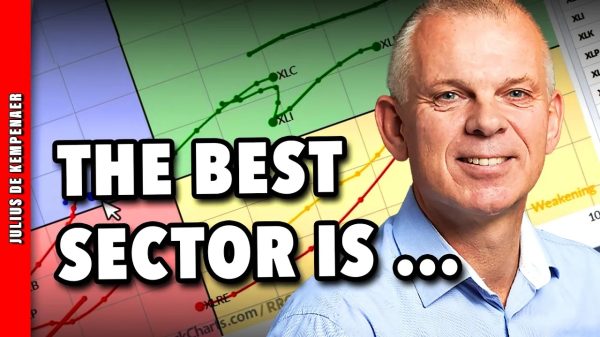
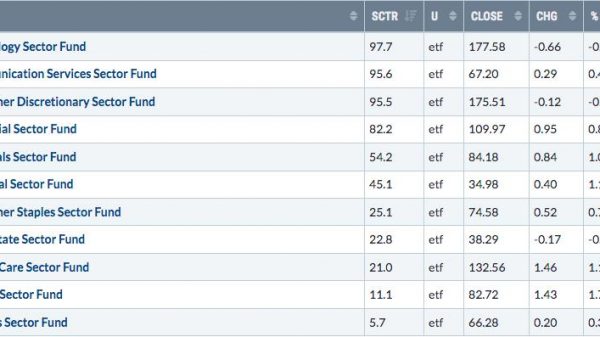
In this exclusive StockCharts video, Julius takes a look at what he recently called “The Best Five Sectors” on a relative rotation graph side-by-side...


In this episode of StockCharts TV‘s The Final Bar, guest Dana Lyons of J. Lyons Fund Management shares two ideas for investors looking to diversify away...
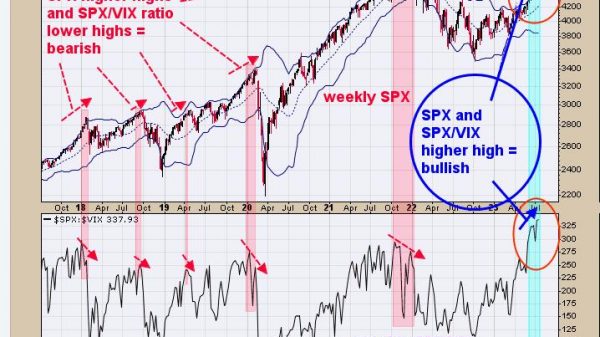
SPX Monitoring Purposes: Long SPX 6/21/23 at 4365.69. Long SPX on 2/6/23 at 4110.98: Sold 6/16/23 at 4409.59 = gain of 7.26%. Monitoring Purposes...


When broad equity indexes move higher and higher and you don’t actively add stocks or ETFs to your portfolio, it’s natural for you to...


In this week’s edition of Trading Simplified, Dave shows his methodology in action by adding two mystery charts and showing how patience has finally paid...


In this episode of StockCharts TV‘s The Final Bar, guest Nick Raich of The Earnings Scout focuses in on one sector that has a lot of...


Popular investing articles tend to get it all wrong when it comes to gold. Most say that gold mining stocks are a way to...

I always refer to monthly options expiration week as “Opposite George” week. It’s a reference to the Seinfeld episode where George Costanza is, as...
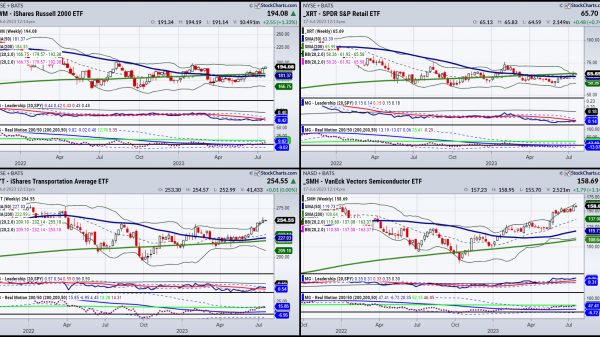
Originally written Sunday, July 16. The bull market in stocks continues to power higher, but there are signs of money moving into sectors beyond...


In this special episode of StockCharts TV‘s The Final Bar, Dave celebrates the S&P 500 making another new high for 2023 and focuses on two key...
This will be the only Daily for this week. (A new one will be available July 24th.) As such, two key areas are in...