Editor's Pick
December non-farm payrolls data came in much hotter than expected. More jobs were added, the unemployment rate dipped slightly, and average hourly wages rose....
Hi, what are you looking for?


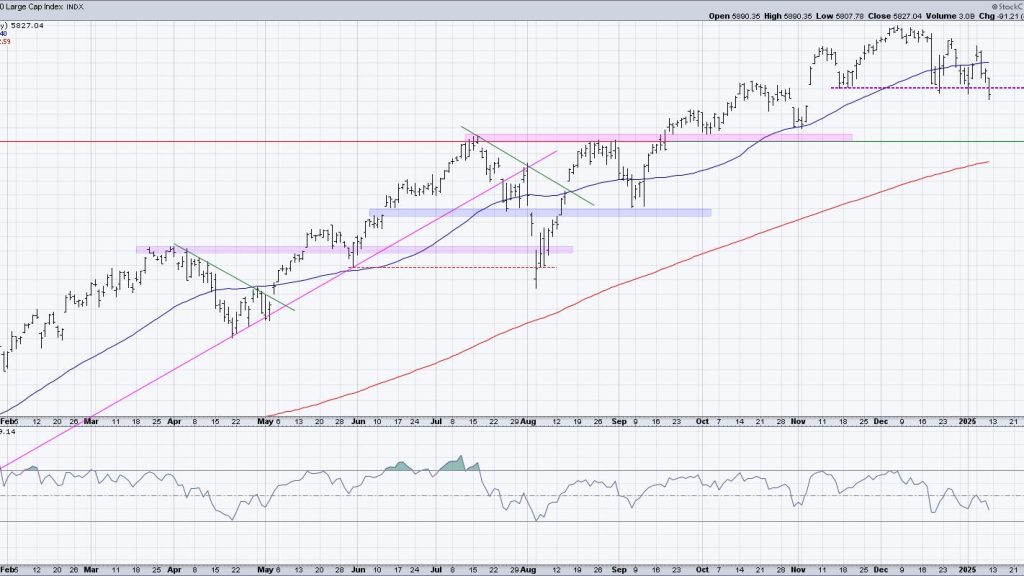
S&P 5850 has been the most important “line in the sand” for stocks since the pullback from the 6000 level in November 2024. With the...
December non-farm payrolls data came in much hotter than expected. More jobs were added, the unemployment rate dipped slightly, and average hourly wages rose....
The composition of the top five sectors remains unchanged this week, despite an interrupted trading week. This stability comes against a backdrop of mixed...
On this week’s edition of StockCharts TV‘s StockCharts in Focus, Grayson explores the two primary charting platforms on StockCharts – SharpCharts and ACP – to highlight...
SPX Monitoring Purposes: Short SPX on 9/1/23 at 4515.77; cover short 9/5/23 at 4496.83 = gain .43%. Gain since 12/20/22: 15.93%. Monitoring Purposes GOLD: Long...
We compiled a list of the 10 biggest uncertainties in the stock market right now. In no particular order: China-trade wars and chip wars...
The Energy sector has the highest percentage of analyst buy ratings (around 64%) of all S&P sectors in the US stock market. The kicker,...
Stocks fell sharply in September with the S&P 500 SPDR (SPY) breaking below its August low. Chartists can now use this low as a...
Last week wasn’t the most optimistic on Wall Street. Even though the US economy is growing, Federal Reserve Chairman Jerome Powell’s comments after the...
The stock market suddenly has the look of a wounded prize fighter. And the bond market is bordering on being dysfunctional. In a word,...
It’s almost impossible to call market tops and market bottoms using basic technical analysis tools like price and volume. Don’t get me wrong, that...
In the previous technical note, it was mentioned that the markets are prone to some consolidation and corrective retracements due to the technical setup...
There’s no denying that we’ve seen signs of distribution from key stocks like Apple, Inc. (AAPL) and Tesla (TSLA) breaking down to breadth conditions...