Editor's Pick
The stock market is in pullback mode with the S&P 500 EW ETF down 5.15% over the past month and down 1% year-to-date. This...
Hi, what are you looking for?


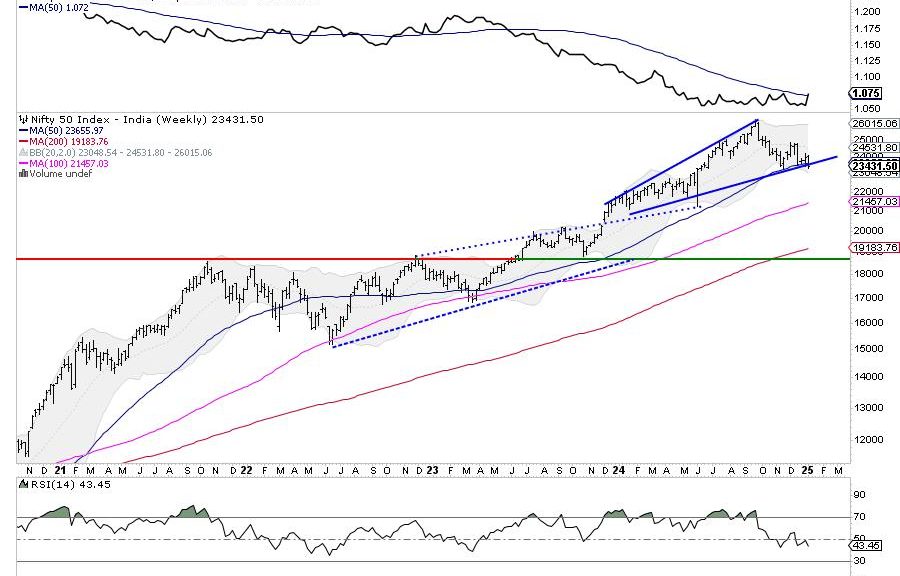
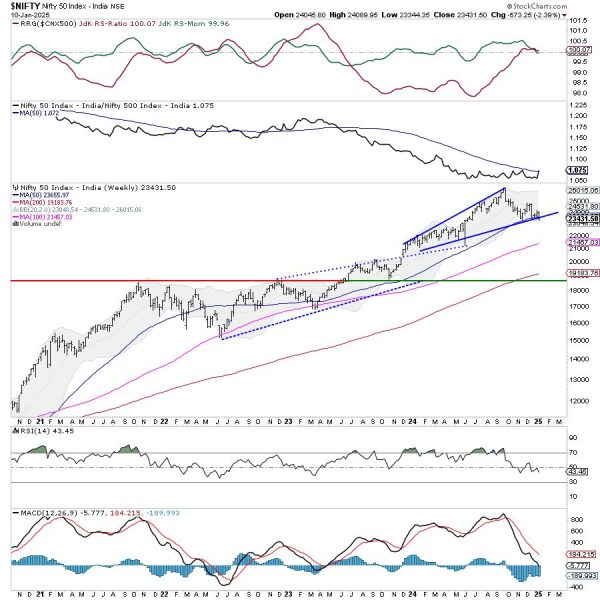
The markets extended their decline over the past five sessions and ended the week on a negative note. While the week started on a...
The stock market is in pullback mode with the S&P 500 EW ETF down 5.15% over the past month and down 1% year-to-date. This...
S&P 5850 has been the most important “line in the sand” for stocks since the pullback from the 6000 level in November 2024. With the...
In this special edition of StockCharts TV‘s The Final Bar, guest Adrien Zduńczyk, CMT, of The Birb Nest shares a groundbreaking seasonality study he created with...
The Fed is done raising interest rates. At least, that’s what the stock market has priced in, based on recent inflation data. We’ve also...
The stock market in 2023 has been tracking the Annual Seasonal Pattern (ASP) really closely — until a late October 2023 extra dip in...
A weaker labor market, manufacturing production slowing, new home prices falling and crude oil inventories rising more than expected are all to blame for...
On this week’s edition of Stock Talk with Joe Rabil, Joe explains how to use multiple timeframes to trade a pullback. He shows the...
In this edition of StockCharts TV‘s The Final Bar, Craig Johnson, CFA CMT of Piper Sandler shares his long-term charts of the S&P 500 and 10-Year...
Brazil planted a record soybean crop only to see unusually dry and hot weather create concerns for the harvest. Furthermore, Argentina had an extreme...
In this edition of StockCharts TV‘s The Final Bar, guest Dave Landry of DaveLandry.com reveals his three charts to define the market trend, limit losses, and...
The Economic Modern Family has opened its loving arms to the bulls and to us after our 2 weeks away. Beginning with Granddad Russell...
In this edition of StockCharts TV‘s The Final Bar, guest Pete Carmasino of Chaikin Analytics puts this week’s action into long-term perspective using his charts of...