


Editor's Pick
In this video, Mary Ellen reviews the market’s flat momentum as uncertainty reemerges after weak AMZN, TSLA and GOOGL reports – PLUS more tariff...

Hi, what are you looking for?

Asian stocks jump after US Fed’s decision: Kospi up 0.5%

Burger King UK seeks £40M refinancing to fund expansion: report

SoftBank to acquire Ampere Computing in $6.5B deal

VolShares to launch first-ever Solana futures ETFs in US tomorrow

US stocks climb as Fed keeps rates steady, Dow Jones, S&P 500, Nasdaq Composite all gain
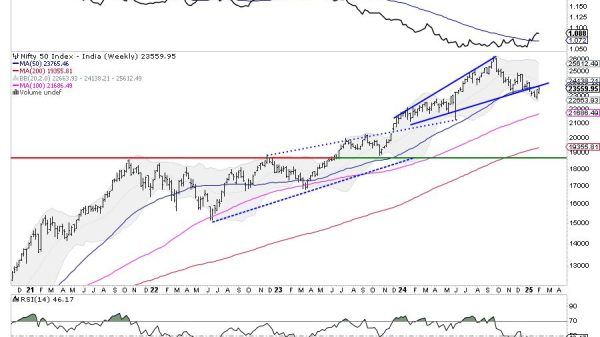
Week Ahead: NIFTY Stares At Crucial Support; RRG Hints At Defensive & Risk-Off Setups
Nasdaq DROPS on Weak AMZN, TSLA & GOOGL Earnings!
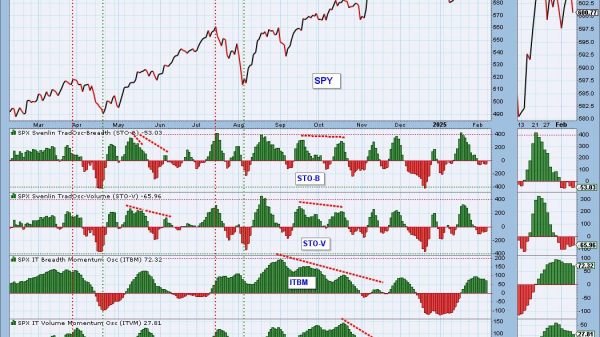
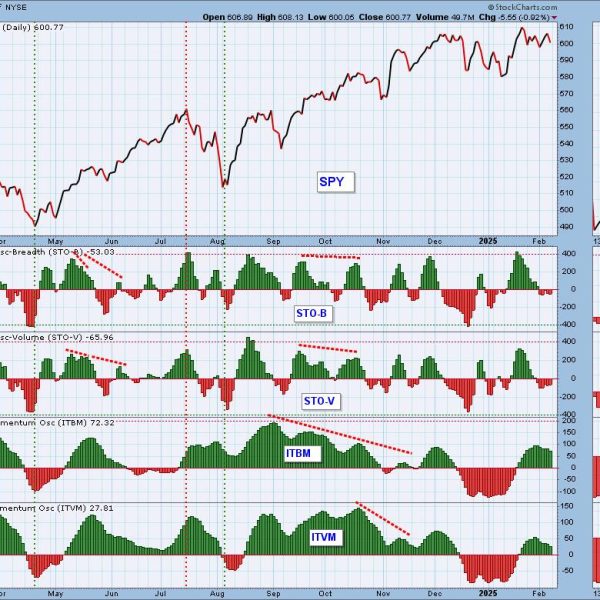
IT Breadth Momentum (ITBM) and IT Volume Momentum (ITVM) Top – Participation Draining
Top 10 Charts to Watch for February 2025
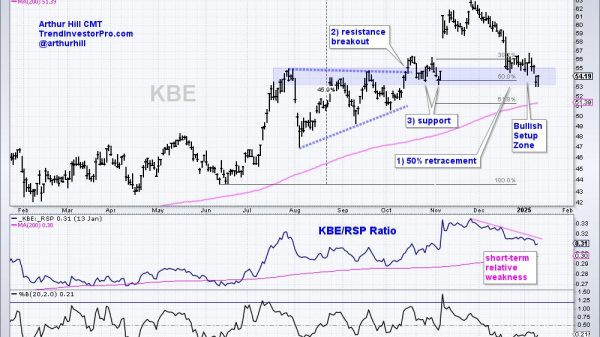
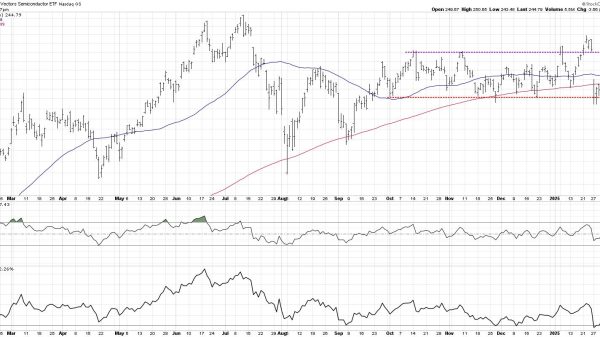
Finance Sector Leads as Bank SPDR Extends on Breakout

Meta’s head of AI research announces departure

Restaurant chain Hooters files for bankruptcy protection to enable founder-led buyout

Elon Musk says backlash against his DOGE government cuts is hurting Tesla stock

AMC bets on premium screens as Hollywood slate boasts big blockbuster titles

Amazon’s Nova AI agent launch puts it up against rivals OpenAI, Anthropic
6 populist leaders facing lawfare around world
Dems mum on Trump’s court fights despite trying to limit Biden-blocking judges
District judges’ orders blocking Trump agenda face hearing in top Senate committee
Courtroom combat: Inside the federal judiciary system where Trump’s agenda is under assault
Trump pressures 4 GOP senators ahead of anti-Canadian tariff vote, accusing them of ‘TDS’
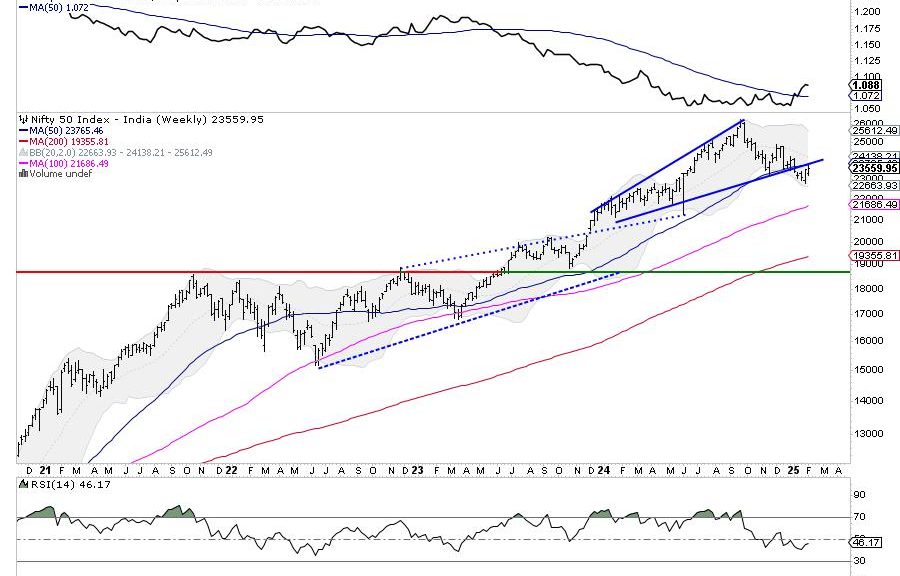
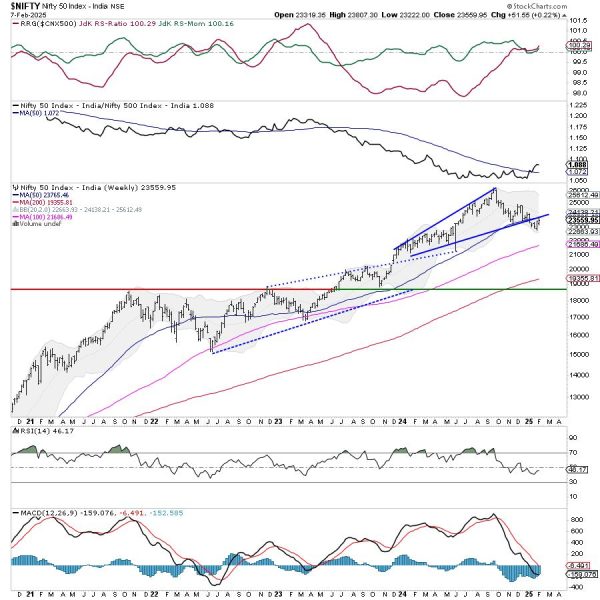
In what can be called an indecisive week for the markets, the Nifty oscillated back and forth within a given range and ended the...
In this video, Mary Ellen reviews the market’s flat momentum as uncertainty reemerges after weak AMZN, TSLA and GOOGL reports – PLUS more tariff...
We are currently in a declining trend in the market and internals are telling us that this weakness will continue to be a problem....

There are a number of effective swing trading systems being used today. Let’s explore one that is popular among Wyckoffians. It uses two inputs:...
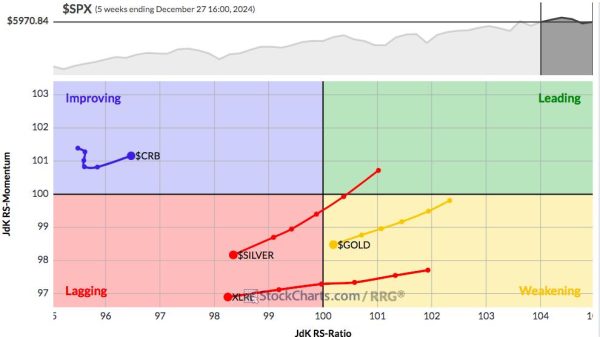
Generally, there are 3 key hedges against inflation – gold ($GOLD), commodities ($XRB), and real estate (XLRE). While the Fed has taken a renewed...
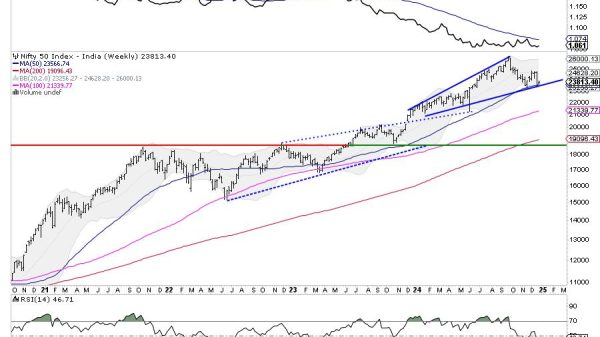

After suffering a brutal selloff in the week before this one, the Nifty spent the truncated week struggling to stay afloat just below the...

In this video, Mary Ellen highlights whether to buy last week’s pullback. She discusses the rise in interest rates and why, as well as...


Are you ready to make 2025 a financially healthy year? The beginning of a new year is the perfect time to set intentions and...


Qubits, quantum advantage, gate speed — these terms could one day be as ubiquitous as AI or large language model (LLM). Quantum computing could...
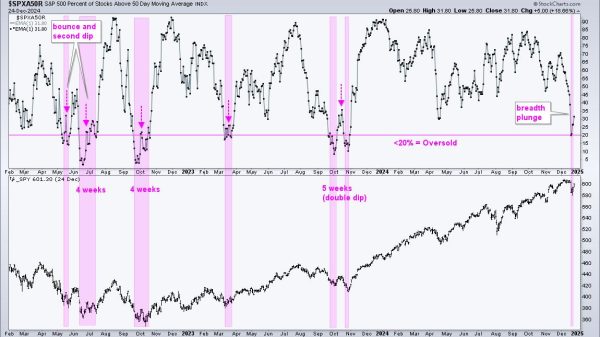
Breadth became oversold last week and stocks rebounded this week. Is this a robust rebound or a dead cat bounce? Today’s report will show...

In this video, after a rundown of the general markets and sectors, Tony brings you the latest options trade ideas. These include a number...


When quickly glancing at the StockCharts Technical Rank (SCTR) Reports Dashboard panel, one stock that popped up on Monday, albiet briefly, was Meta Platforms,...

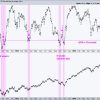
In today’s free DecisionPoint Trading Room Carl discusses volume spikes and how we have to analyze big volume spikes carefully to determine whether they...