


When Wall Street rings its opening bell, there are two things you need to do to start your day:
Get the big picture on what’s happening in the markets. Spot the market opportunities, especially the ones that aren’t apparent.
There are plenty of ways to get your market updates. The slowest way would be to tune into financial news, scroll through headlines, and read all the articles. Now, you may end up doing that anyway; it’s always a temptation. But why not start your day with a fast scan? This is what StockCharts’ MarketCarpets was designed to do.
Get the Big Story
It’s Monday morning, and the S&P 500 ($SPX) continues to drive into record-high territory.
Log onto your StockCharts account and, from Your Dashboard:
Click Charts & Tools > MarketCarpetsSelect S&P 500 from the Select Group dropdown, Performance from the Measurement dropdown, and 1D Change from the Color By dropdown.
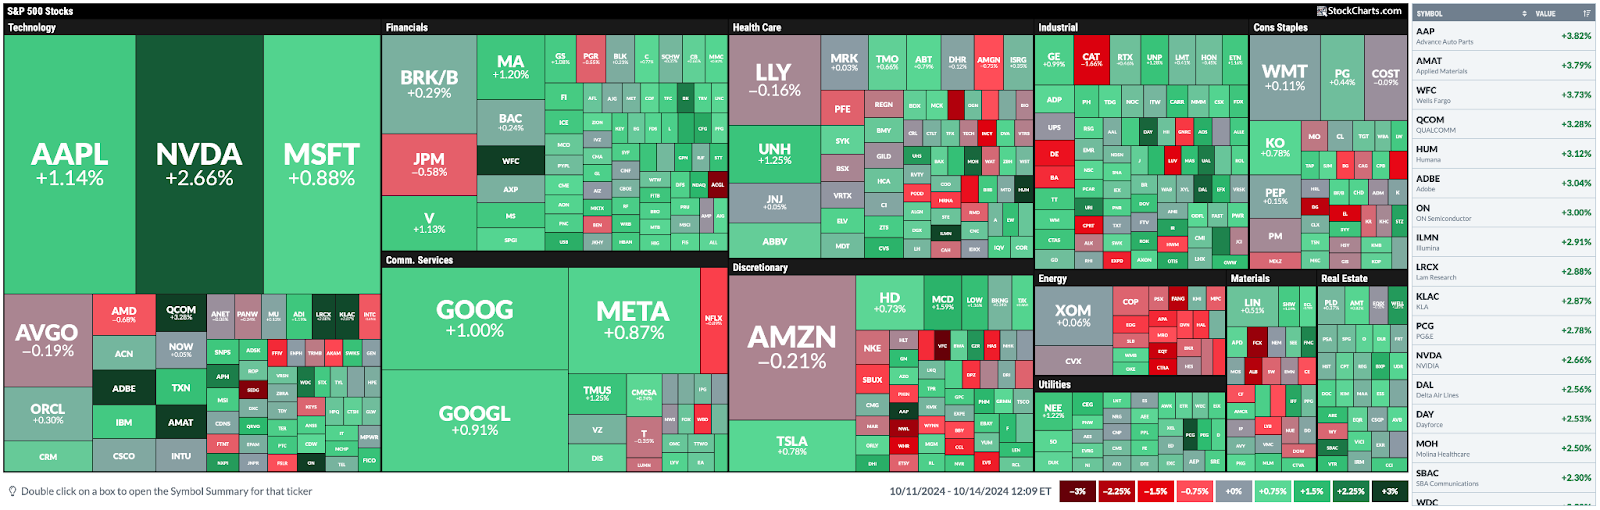
Below is a more comprehensive snapshot of what’s happening from a price-performance viewpoint.
FIGURE 1. MARKETCARPETS SNAPSHOT OF THE S&P 500. This view is measured by market performance.Image source: StockCharts.com. For educational purposes.
What’s this telling you? Technology stocks are driving up the S&P 500, with Nvidia (NVDA), Qualcomm (QCOM), Applied Materials (AMAT), and Adobe (ADBE) among the bigger players leading the way. You can also view this on the summary on the right side of the carpet view.
The sectors from the middle to the right also show a lot of red, with stocks declining. Health Care, Consumer Discretionary, Industrials, Consumer Staples, Materials, and especially Energy are having a rough start early in the day. This gives you the real-time performance of the stocks in the index.
But which stocks might be strengthening or weakening from a technical perspective? This is something that a snapshot of price will not immediately tell you. So, let’s switch over to the StockChartsTechnicalRank (SCTR) measurement to find out.
Select SCTR from the Measurements dropdown. Below is a snapshot of the MarketCarpet measured by SCTR colored by 1D change.
FIGURE 2. SNAPSHOT OF THE S&P 500 MEASURED BY SCTR. This view shows a different performance perspective of stocks in the S&P 500.Image source: StockCharts.com. For educational purposes.
StockCharts Tip: To see which stocks have high and low SCTR values at a specific time, select Latest Value from the Color By dropdown menu.
So, what is this telling you, in contrast to the previous view? First, it tells you that many stocks within each S&P sector are technically weakening. Second, it calls your attention to certain stocks that might be technically strengthening or weakening regardless of their intraday performance.
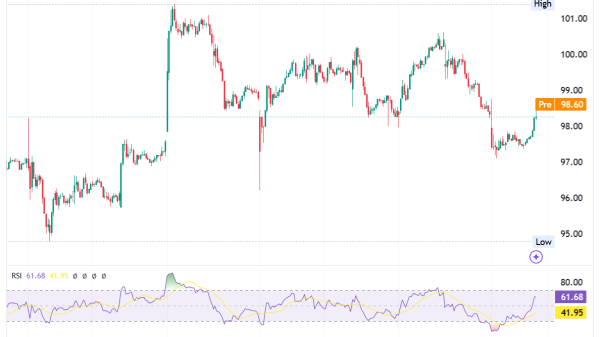
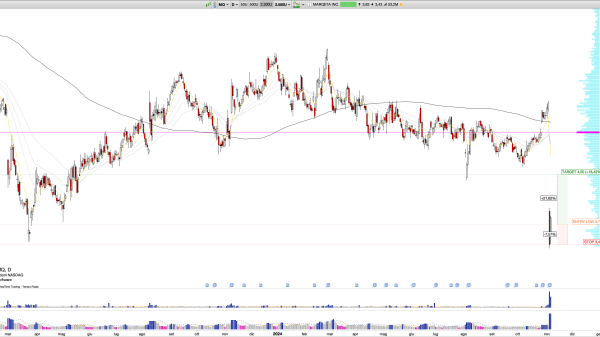
QCOM showed dark green on both carpets, indicating strong performance and increasing SCTR score. Let’s zoom in on a daily chart of QCOM.
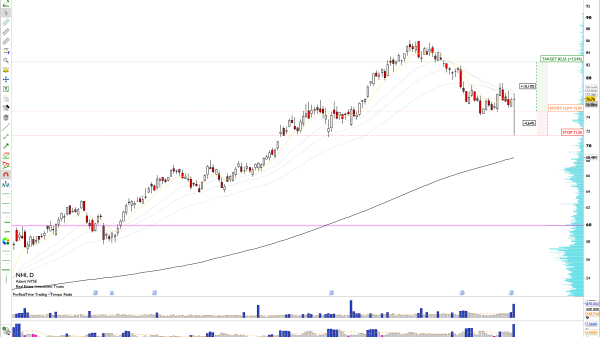
FIGURE 3. DAILY CHART OF QCOM. Is the stock on the verge of a breakout?Chart source: StockCharts.com. For educational purposes.
QCOM looks like it’s on the verge of breaking out from an ascending triangle pattern, which, as you know, is bullish.But it also shows a slight bearish divergence in momentum as buying pressure, according to the Chaikin Money Flow, is dwindling.While the SCTR line (above the chart) is improving, it’s also fluctuated within a range over the last two months.Overall, you’ll want to see what happens after the breakout if or when it comes.
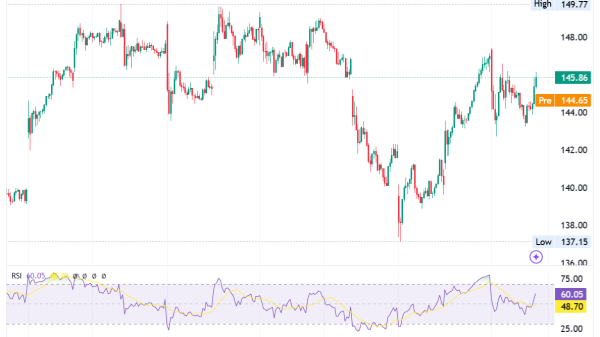
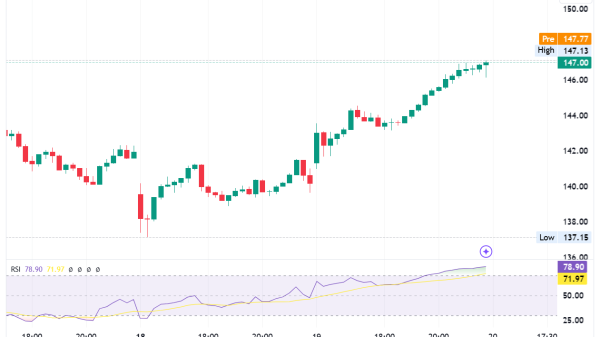
Now, let’s look at a daily chart of AMAT, which also showed a positive intraday performance on MarketCarpets, but a more lukewarm performance on the SCTR view.
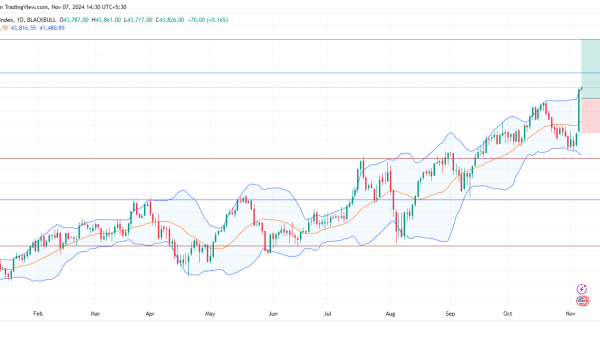
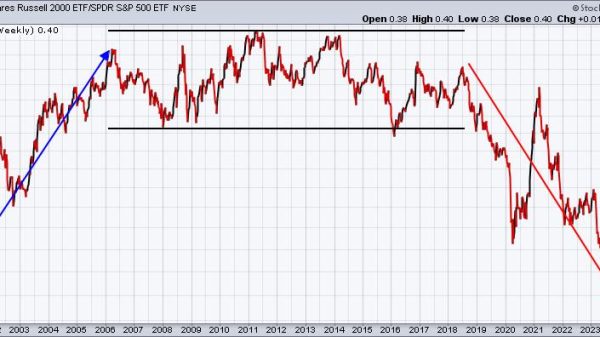
FIGURE 4. DAILY CHART OF AMAT. Note the difference between AMAT’s and QCOM’s charts despite similar performances and SCTR readings.Chart source: StockCharts.com. For educational purposes.
AMAT’s SCTR score on MarketCarpets may not be anywhere near its one-day performance by price, but it may be enough to call your attention to do a deeper dive. In contrast to QCOM, AMAT’s SCTR line is rising (as shown in the panel above the chart). AMAT is also on the verge of a breakout.
Unlike the QCOM example, however, AMAT double-bottomed (see blue circles). At the same time, its momentum on the CMF shows an overwhelming bullish divergence (see black arrows) while buying pressure (see blue rectangle) is in the green.
What You Can Do Now (Action Points)
What you saw was just a quick and dirty overview of what you can do as part of your morning scanning routine using MarketCarpets. Try these:
Add stocks that pique your interest to a ChartList using this method.Scan other indexes, such as the Dow Industrials and Nasdaq 100, for a broader market overview; other opportunities might be hidden in other market areas.Scan sectors and look at their seasonality profiles to understand which stocks may be ramping up this time of year.Toggle between lookback periods to distinguish sudden changes from those that are slowly developing.Change measurements to the various available indicators, such as the Relative Strength Index (RSI), Bollinger Bands, Full Stochastics, and more, especially if you use any of these indicators for your charting.
Here’s the main point: It’s about getting a fast, comprehensive. and multi-angled overview. The more you can see—quickly and efficiently—the more opportunities you can find with greater ease and without wasting time.
At the Close
MarketCarpets is your go-to for a fast, no-nonsense market scan. It helps you quickly analyze market trends and spot hidden opportunities by toggling between performance and other technical indicators like SCTR. This allows you to identify which stocks are heating up (or cooling down) without wasting time on endless headlines. Add this to your morning routine and seize opportunities quicker than ever.
Disclaimer: This blog is for educational purposes only and should not be construed as financial advice. The ideas and strategies should never be used without first assessing your own personal and financial situation or without consulting a financial professional.