


BETA
One of the Risk ON/OFF metrics I like to keep an eye on is BETA.
From Investopedia:
Beta (β) is a measure of the volatility—or systematic risk—of a security or portfolio compared to the market as a whole (usually the S&P 500). Stocks with betas higher than 1.0 can be interpreted as more volatile than the S&P 500.
I have updated my spreadsheet with last year’s data for this article. And I want to take a look at the current (sector) rotations with the BETA for each sector.
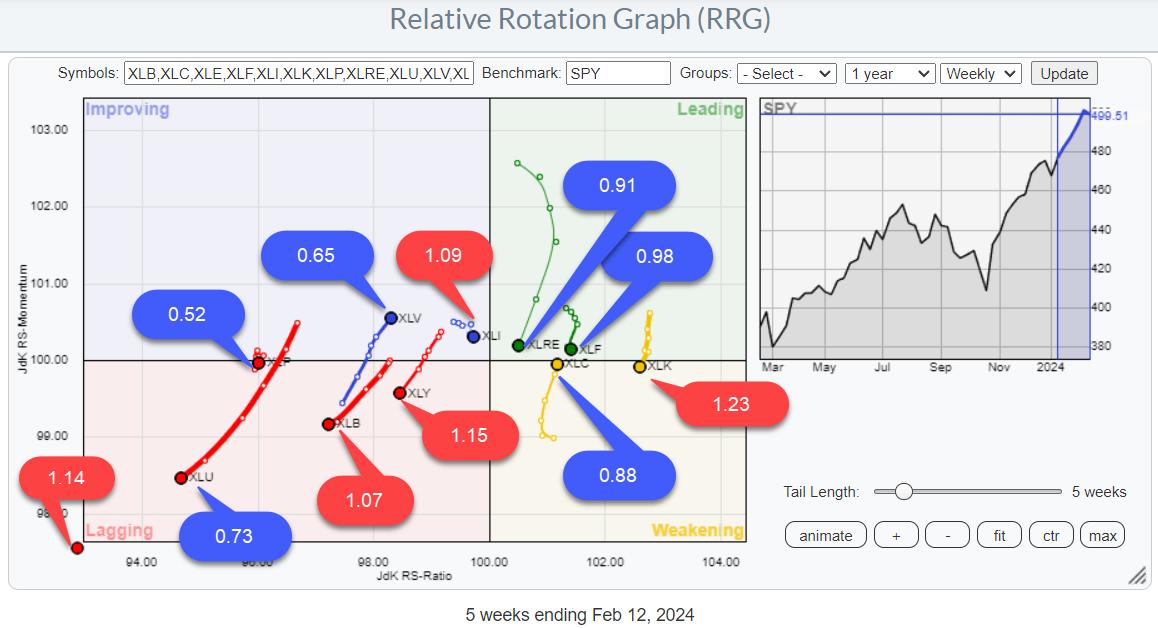
On the Relative Rotation Graph above, you will find the 12-month BETA values for all sectors.
Before diving into the sector rotation part, a quick look at the BETA values. As said the RRG at the top shows the 12-month BETA values.
The tables below show 12- and 36-month BETAs side by side.
Note that there are only minimal position switches among sectors. There may be some significant differences in BETA values over time. Most notably, the energy sector which has a BETA of 1.39 over 36 months but “only” 1.14 over 12 months.
Nevertheless, the top three sectors did not change. The same goes for the bottom three sectors.
My expectation regarding rotations is that I would expect the high-BETA sectors to show strong rotations during strong periods for $SPX and strong rotations for low-BETA sectors during weak periods for $SPX.
No Dominance On Either Side
Looking at that RRG, I do not see a dominant direction for either high-BETA or low-BETA sectors as a group.
The highest BETA sector (1.23) has the highest reading on the RS-Ratio scale and just dropped into the weakening quadrant, while Energy (1.14) is deep inside, lagging but starting to curl back up. Discretionary (1.15) is clearly inside, lagging and heading further into that quadrant.
In the low-BETA group, we see Utilities (0.73) nose-diving deeper into the lagging quadrant, while Staples (0.52) is static at a low RS-Ratio reading. Health Care (0.65) is the exception here, with a strong trajectory into the improving quadrant at a strong RRG-Heading.
The RRG image is mixed, with no clear preference for either group.
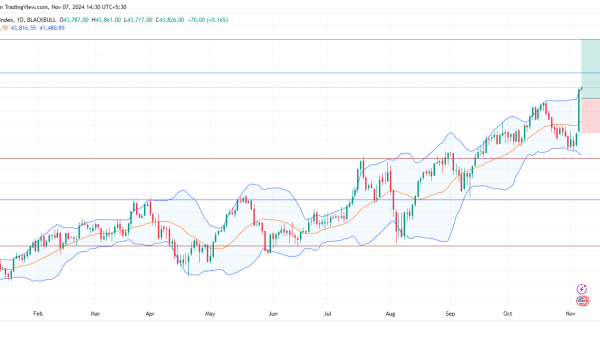
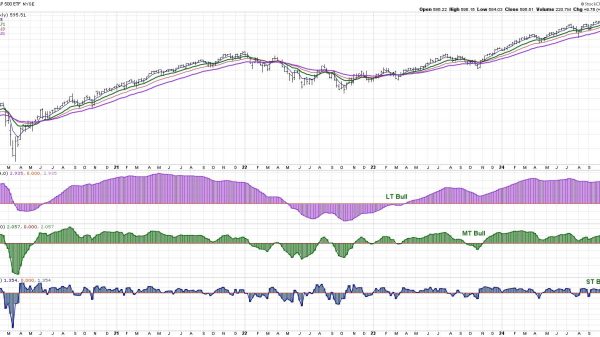
Bringing that observation to the SPY chart (daily) helps interpret the index’s recent price action.
SPY Outlook
Breaking the previous all-time high (January 2022) was obviously a bullish sign. New ATHs are not a sign of bear markets, right?
And so was the rally that followed after the break. A regular rhythm of higher highs and higher lows took SPY to a new ATH at 503.50. Even the shock decline last Tuesday has not damaged this up-trend yet.
However, the mixed rotations on the RRG, combined with a negative divergence building up between SPY and its RSI, signal some hesitation. At least something to be aware of.
Downside risk seems limited, with the former resistance at 480 now expected to return as solid support in case of a decline.
Clearly, a push beyond 503.50 will again be a bullish signal for the market. On the downside, I am watching the lower boundary of the new short-term channel and the previous low at 490. Breaking these levels subsequently will very likely trigger a decline back to the breakout level near 480.
What happens there will be crucial for further development in the coming months.
For the time being, the uptrend is still intact, with limited near-term risk. (4-5%)
#StayAlert. –Julius