Last year’s vaccine sales decline hurt Moderna’s stock (MRNA), making it one of the worst performers in the S&P 500 in 2023. The weekly chart below will give you a bird’s eye view of how the stock has performed.
Now that the company is widening its offerings to include respiratory syncytial virus (RSV) and influenza vaccines, analysts are noticing MRNA, which received an analyst upgrade. That sent the stock higher in Tuesday’s trading.
CHART 1: WEEKLY CHART OF MRNA STOCK. After being beaten down since its 2021 high, MRNA’s stock price shows signs of rising higher. A break above the 50-week simple moving average could confirm the uptrend.
Chart source: StockCharts.com. For educational purposes.Is now a good time to buy MRNA stock? Let’s look at the daily chart.
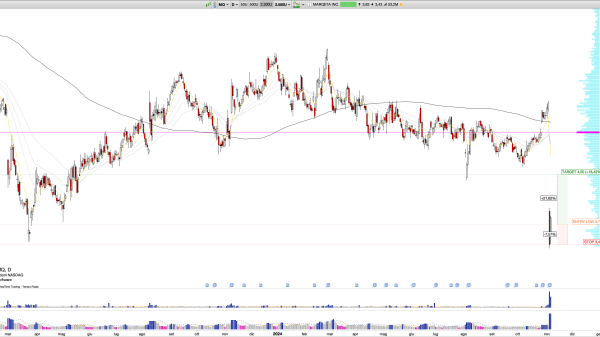
CHART 2: DAILY CHART OF MRNA STOCK PRICE. The stock has broken above its upper Bollinger Band, its RSI is above 70, and its SCTR score is shy of 70. If price continues rising and has the momentum for more upside, this stock could be worth buying.Chart source: StockCharts.com. For educational purposes.
The Upside
MRNA’s stock price has broken above its upper Bollinger Band®, and its relative strength index (RSI) is above 70, indicating that it’s in overbought territory. But it has just crossed over the 70 level, which means there could be room for further upside in the stock.
The StockCharts Technical Rank (SCTR) score has spiked up and is just shy of the 70 level. A cross above 70 would make it a strong candidate for an upside move.
Volume is another indicator that can help gauge momentum in a stock. Volume spiked on Tuesday, which is a good indication of upside momentum. If volume remains above average as the stock price moves higher, that indicates positive momentum. As long as the stock continues to show technical strength, MRNA stock could be a good long candidate to add to your portfolio.
One day doesn’t confirm a trend, but it’s worth adding MRNA to your ChartLists. If momentum looks strong and MRNA’s stock price continues to rise and break above its 50-week SMA on the weekly chart, that would be a good time to open a long position in MRNA stock. This year may be a turnaround year for MRNA’s stock price.
The Downside
When investing in stocks, your priority is to protect your positions. So, always anticipate that things could go in the opposite direction.
Watch For Non-Confirmation In the Bollinger Bands
It helps to look for the following three scenarios:
A security creates a reaction high above the upper band.
There’s a pullback towards the middle band.
Prices move above the prior high but fail to reach the upper band. This is a warning sign. The inability of the second reaction high to reach the upper band shows waning momentum, which can foreshadow a trend reversal. The final confirmation comes with a support break or bearish indicator signal.
The Significance of the SCTR Score
In a nutshell, SCTR is a numerical score that ranges from 1 to 100. The higher the value, the higher the stock’s rank. To get a high SCTR rank, a stock or ETF should score high, with all the indicators used to calculate the SCTR score in the short-, medium-, and long-term time frames.
The SCTR score identifies the leaders and laggards within specific industry groups. Since the calculations are done for you, you only have to add the indicator panel on SharpCharts or StockChartsACP.
The Bottom Line
MRNA’s stock price had the biggest upmove in the S&P 500 on the first trading day of 2024. If MRNA breaks above its 50-week SMA, the next resistance level is around $200, which is much higher than the analyst’s price target. This year could be a turnaround year for MRNA. Biotech stocks can be challenging, since any mishaps in drug production can send the stock price into the doldrums. So, if you are investing in MRNA, watch the charts closely and be prepared to sell the stock on any signs of weakness.
Disclaimer: This blog is for educational purposes only and should not be construed as financial advice. The ideas and strategies should never be used without first assessing your own personal and financial situation, or without consulting a financial professional.

