Weekly Key Support and Market Resistance Report
Forex and CFD trading success or failure largely depend on the choice of assets. In fact, the correct direction is of much more significance than the specific methods, when it comes to trading entries and exits. To start the week, it is advisable to consider the broader market developments influenced by macro fundamentals, technical factors, and market sentiment. Currently, there are only a few favorable long-term trends in the market. Read on for a comprehensive weekly analysis.
Fundamental Analysis & Market Sentiment
In the previous analysis on May 7th, the suggested trade opportunities for the week included the EUR/USD currency pair, the NASDAQ 100 Index, and the GBP/USD currency pair. However, these trades did not materialize as expected, resulting in an overall loss of 0.95%.
The market is currently influenced by slightly lower-than-expected US inflation data from last week. It showed a minor decline from 5.0% to 4.9%. Despite the seemingly positive economic news, the core Consumer Price Index (CPI) was higher than expected. In fact, it indicated much less optimistic inflation data. Initially, stock markets rallied and the US Dollar weakened in response. However, as the news spread further, the US Dollar regained strength. This change in sentiment aligned with the Federal Reserve’s hints that the current rate tightening cycle has not yet reached its end.
Last week, the Bank of England strongly impacted the Forex market. It caused a 0.25% rate hike, bringing the Official Rate to 4.50%. The focus in the upcoming week will be on the release of US retail sales data and Canadian CPI (inflation) data.
Key data releases from the previous week included US Unemployment Claims data, UK GDP data (showing a decline), US Preliminary UoM Consumer Sentiment (considerably worse than expected), and New Zealand Inflation Expectations data (indicating a drop).
The Market Week Ahead: 15th – 19th May
Compared to the previous week, this week is expected to have lower volatility. The traders are not anticipating scheduled high-impact releases to have as significant of an impact as the US CPI data. The key data releases for the week, in order of importance, include US Retail Sales data, US Unemployment data, Canadian CPI (inflation) data, US Empire State Manufacturing Index data, UK Claimant Count Change, Australian Wage Price Index data, and Australian Unemployment data. Additionally, Thursday will be a public holiday in Germany, France, and Switzerland.
Technical Analysis
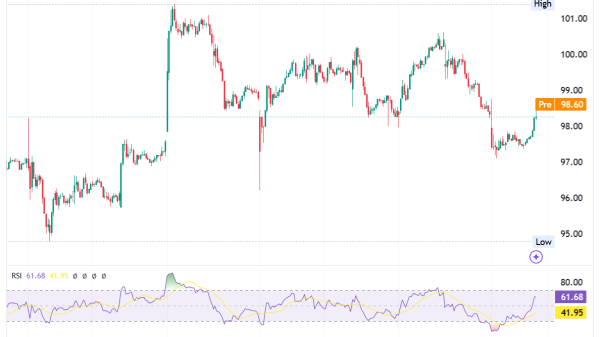
US Dollar Index
Last week, the US Dollar Index experienced a strong rise, indicating a potential reversal from its long-term bullish trend. The weekly candlestick formed a bullish engulfing bar, closing at its high price, which further supports a bullish outlook. However, the greenback remains within a valid long-term bearish trend, and it ended the week near a key resistance level of 102.80. Caution is advised when trading against the US Dollar unless a strong bearish reversal occurs around the 102.80 level.
NASDAQ 100 Index
The NASDAQ 100 Index witnessed a slight increase last week, displaying a weakly bullish outlook. The weekly candlestick closed higher but formed a doji candlestick, suggesting indecision. The price closed in the middle of its range, with the lower wick rejecting the round number at 13200. The index achieved its highest weekly close and high prices since August 2022, indicating a valid long-term bullish trend. With no significant resistance levels until 13730, the NASDAQ 100 Index appears favorable for further upward movement.
In the upcoming week, investors who are ready to take a chance on a trade with a high potential reward-to-risk ratio can try to purchase any rebounds at important support levels here. At least, until there is a daily close below $1.0790.
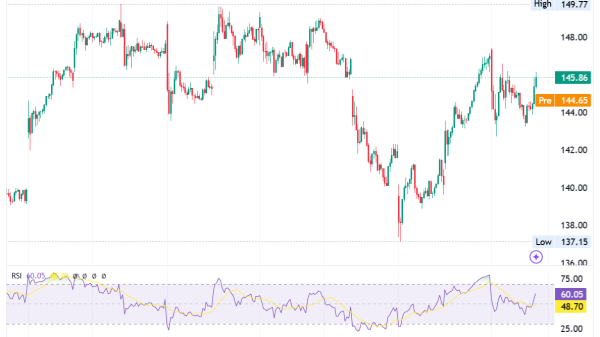
US Dollar to Japanese Yen Index
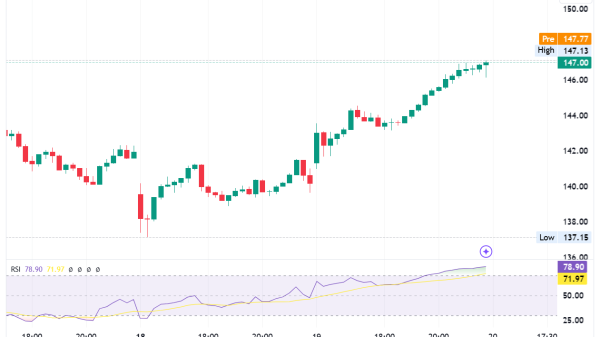
Last week, the USD/JPY currency pair rose significantly. The rise produced a bullish piercing candlestick that ended at the peak of its range.
The price appears to be rising once again to test the region where we have a long-term bearish double top. With the range between 137.35 and 137.50, it is likely to act as a crucial turning point. The price may continue to make a much more dramatic bullish move if it can establish itself above that level.
Despite the US Dollar’s ongoing upward trend, it will be unwise to trade against the US Dollar throughout the upcoming week as we are witnessing a strong bullish reversal. This might make day trading long on this currency pair appealing.
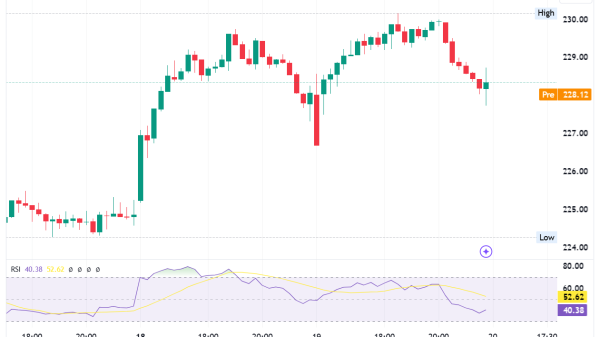
Gold Index
Over the last week, the price of gold in US dollars decreased very slightly. However, it still closed above $2000 per ounce, near its best weekly culmination since August 2020. This came after the price came extremely near to matching its record high the week before last at roughly $2,070.
This week’s price chart shows a candlestick that is both an inside bar and a doji. Bulls can point to the relatively high weekly close above the big round number. The ongoing long-term bullish trend, as well as the fact that Gold held its value in USD terms very well during a very strong week for the USD, indicates that strength remains in Gold. These factors could cause bulls to be cautious since they indicate uncertainty. Therefore, it could mean a potential trend reversal.
It’s important to keep in mind that the price of gold historically has a strong positive correlation with the US stock market. Even though, frequently it does appear to be a hedge. In light of the fact that both stocks and gold are now increasing, one may argue that this move is stronger.
WTI Crude Oil Index
Crude Oil’s price dropped this past week for the fourth time in a row and ended up just where it started.
The WTI chart for this week indicates that a long-term negative trend is well-established within it. Besides, a linear regression analysis of recent price action reveals that this trend is highly well-defined and symmetrical. This suggests that shorting this trend may be a rational decision.
It is unclear whether there are sufficient basic variables affecting supply or demand. Moreover, it is hard to tell if this trend has much further to run, but we must notice the trend’s endurance.
In the past, trading WTI has been successful when trading well-defined breakouts to long-term highs or lows. So, if we have a daily close below $65 here, there can be a possibility of opening a new short position.
Market Predictions
A candlestick that is a cross between a doji and a pin bar was printed this past week, though, which caused a little decline. Despite the extremely high relative volatility, which tends to predict lower prices, this is only marginally suggestive of higher prices.
Bulls should be mindful that the price has increased significantly and that the trend may be considered to be much over-extended. It is often difficult to predict where such strong trends may reverse. Therefore, before starting a new long trade here, I would rather wait for a consolidation and subsequent strong breakout.
At $14.25 and $15.00, potential resistance levels may appear.
Historically, trading new 6-month high breakouts in commodities has been quite profitable while using a volatility-based trailing stop. The following are a few of this week’s top trading opportunities:
The prolongation NASDAQ 100 Index;
Long-side day trading of the USD/JPY currency pair;
Gold purchasing if it decisively recovers at important support levels like $1949 or $1918;
WTI crude oil shortening, if the market’s daily close price falls below $65.
The post Weekly Key Support and Market Resistance Report appeared first on FinanceBrokerage.

