Connect with us

Hi, what are you looking for?

Stock

3 S&P 500 Charts That Point to the Next Big Move

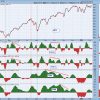
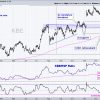
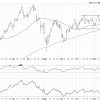
Follow along with Frank as he presents the outlook for the S&P 500, using three key charts to spot bullish breakouts, pullback zones, and MACD signals. Frank compares bearish and bullish setups using his pattern grid, analyzing which of the two is on top, and explains why he’s eyeing SMCI and AMD as potential trades. From there, he wraps the show with a look at some ETF plays.

This video originally premiered on June 17, 2025.

You can view previously recorded videos from Frank and other industry experts at this link.

    You May Also Like

    Editor's Pick

    We are currently in a declining trend in the market and internals are telling us that this weakness will continue to be a problem....

    Editor's Pick

    The Finance sector is leading the market with a new high this week and the Bank SPDR (KBE) is extending on its breakout. Today’s...

    Editor's Pick

    While the major equity averages are certainty up year-to-date, we’re detecting a growing number of signs of leadership rotation.  As the Magnificent 7 stocks...

    Stock

    In this video, Joe shares how to use MACD and ADX indicators to analyze stock pullbacks, focusing on the good while avoiding the weak...