


Whipsaws and losing trades are part of the process for trend-following strategies. These are expenses, and simply unavoidable. Over time, trend-following strategies will catch a few big trends and these profits will more than cover the expenses. Let’s look at signals and backtest results for the Cybersecurity ETF (CIBR).
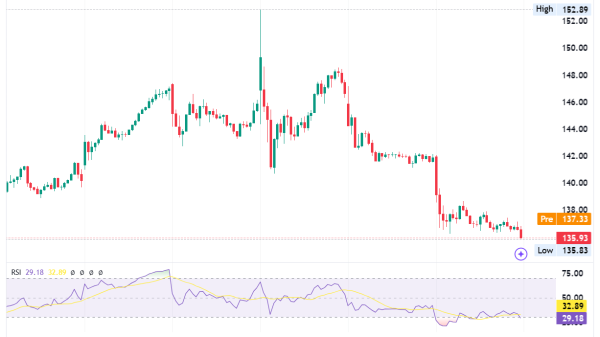
The chart below shows the Cybersecurity ETF (CIBR) with the Percent above MA indicator in the lower window. This indicator measures the percentage difference between the 5 and 200 day SMAs. I use +3% and -3% for signal thresholds to reduce whipsaws. A whipsaw (WS) is a short-lived signal that does not develop into a trend and results in loss. Thus, an uptrend signals with a cross above +3% and remains in force until a cross below -3%. On the chart below, the green lines show uptrend signals since 2020 and red lines show downtrend signals. The blue WS marks the whipsaws. Note that Percent above MA is one of 11 indicators in the TIP Indicator Edge Plugin.
CIBR started trading in July 2015 and did not have a 200-day SMA until April 2016. The chart above shows four bullish trend signals (green lines) since 2020, but we can backtest to 2016 for a more complete picture. There were just 7 trend signals since April 2016 with four producing winning trades and three resulting in losses. This includes the current open trade, which started with the trend signal in May 2023. The average gain for the winners was 43% and the average loss for the losers was 6%. Winners generate gross revenues, while whipsaws and losing trades are expenses. Trading is profitable as long as the profits are bigger than the expenses. This simple trend-following strategy generated a Compound Annual Return of 10.5% since 2016. Not bad for just 7 trades.
Stocks were hit hard the first week of September and came roaring back this past week. In our comprehensive weekly report and video (here), we featured a bullish continuation pattern in SPY, a contracting range in QQQ and bullish charts for ETFs related to fintech, cybersecurity, housing medical devices and wind energy. We also provided detailed analysis for seven big tech stocks (MSFT, META, QCOM, ARM, DELL, AVGO and NVDA). Click here to learn more and get two bonuses.
/////////////////////////////////////////////