


Numerous companies are making strides within their respective sectors, but, unless you follow the sector closely, you might not be aware of them. That’s what makes StockCharts Technical Rank (SCTR) reports so helpful.
If you’ve checked your SCTR reports regularly, you might have noticed Insmed (INSM) appear at or near the top over the last three months.
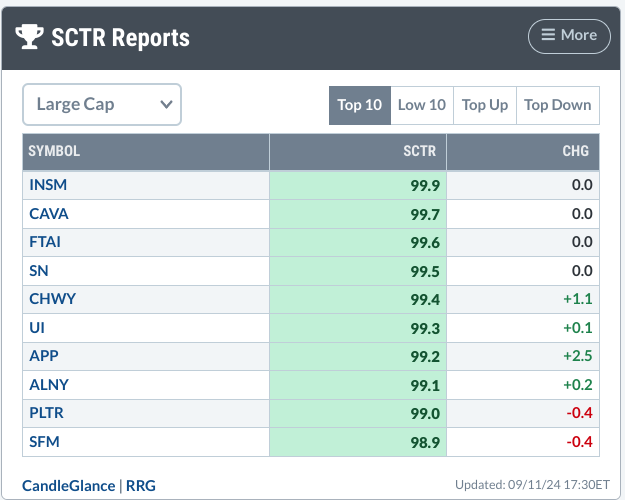
FIGURE 1. DAILY SCTR REPORTS SHOW INSM IN THE OF THE TOP-UP, LARGE-CAP STOCKS.Image source: StockCharts.com. For educational purposes.
Insmed (INSM) is a biotech company that has had a near-perfect SCTR score of 99.9 since the end of May.
A SCTR (pronounced scooter) score above 90 is exceedingly bullish, as it signals technical strength across multiple technical indicators and timeframes. Sustaining a score well above 90 for months tells you that something tremendous is happening with the company and its stock.
But if you don’t follow biotech, you’re probably wondering, “What is Insmed? Why haven’t I heard of it? Why is it soaring now? Where was it before it showed up on the SCTR report’s top spot?”
In a Nutshell, Here’s What’s Driving INSM
Insmed’s stock is popping thanks to positive results from a late-stage study of its antibiotic drug Arikayce, developed for treating a rare, severe lung infection. The study’s success boosts hopes for broader FDA approval, driving INSM’s sharp breakaway gap to all-time highs.
Before this, however, what did INSM’s performance look like?
Three-Year Lookback at INSM’s Performance
FIGURE 2. WEEKLY CHART OF INSM. The recent tests catapulted INSM to all-time highs.Chart source: StockCharts.com. For educational purposes.
Take note of the following points:
The breakaway gap (see orange short-term downsloping trend line) from $22 to $49.53 marked a 125% spike.While INSM’s SCTR score has exceeded the 90 line four times in the last three years (see green circles), notice how it barely outperformed, and largely underperformed, its broader industry, represented by the Dow Jones U.S. Biotechnology Index ($DJUSBT).The latest break above the 90 line looks flat-out bullish (see green rectangle), aligning with a 171% outperformance of its industry.
Does this make INSM a strong candidate for a long position? To explore that further, let’s shift to a daily chart.
Should You Go Long INSM?
FIGURE 3. DAILY CHART OF INSM. Note the declining momentum and topping formation.Chart source: StockCharts.com. For educational purposes.
Here are the main things to keep an eye on:
INSM looks to be forming a double top; still, market sentiment reacting to INSM’s latest testing news and developments moving forth may defy (bearish) technical indications.The Chaikin Money Flow (CMF) shows that buying pressure is fading, matching up with the Relative Strength Index’s (RSI’s) bearish divergence signal from overbought levels.Despite looking toppy, for INSM’s near-term uptrend to continue, you’d want to see it break above resistance at its all-time level of $80.53 while remaining above its most recent swing low at the $70 range.If it falls below the $70 range, the next lines of support can be at the previous swing lows of $67.20 and $61.50.
Warning: A deeper correction may indicate that something is off between the technical reading and the market’s reaction to the company’s news or product development.
If INSM falls below $61.50, the long-term uptrend could still hold despite invalidating the short-term trend. Be extra careful, though! INSM might slide to $45–$52, hitting key Fibonacci retracement levels, but a dip that low could mean something big has changed with INSM’s product development, and the price action may be reflecting the market’s response to these (bearish) developments.
Closing Bell
StockCharts’ SCTR Reports spotlight hidden stock opportunities that might not have crossed your radar. Insmed is a great example. It’s been riding high on positive testing news, but its technicals are flashing warning signs. If you want to follow INSM’s price action, add it to one of your StockCharts ChartLists. If not, be sure to use SCTR daily to find other (potentially hidden) opportunities for your next trade.
Disclaimer: This blog is for educational purposes only and should not be construed as financial advice. The ideas and strategies should never be used without first assessing your own personal and financial situation, or without consulting a financial professional.