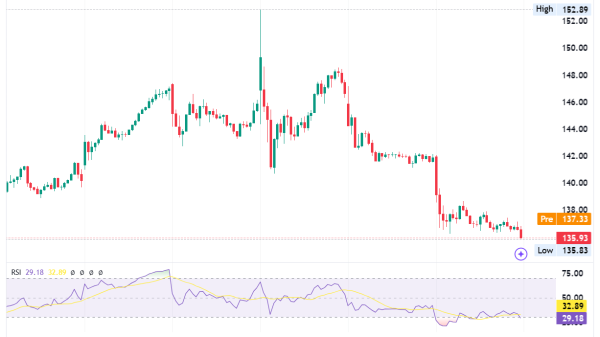


Much like the southeastern portion of the U.S. frets over the potential of devastating hurricanes, stock traders and investors brace for their own financial hurricane this time of year. Last week, we saw the NASDAQ 100 ($NDX) tumble, dropping nearly 6% during a holiday-shortened trading week. This isn’t unusual. The NDX has lost ground during September in 9 of the past 12 years:
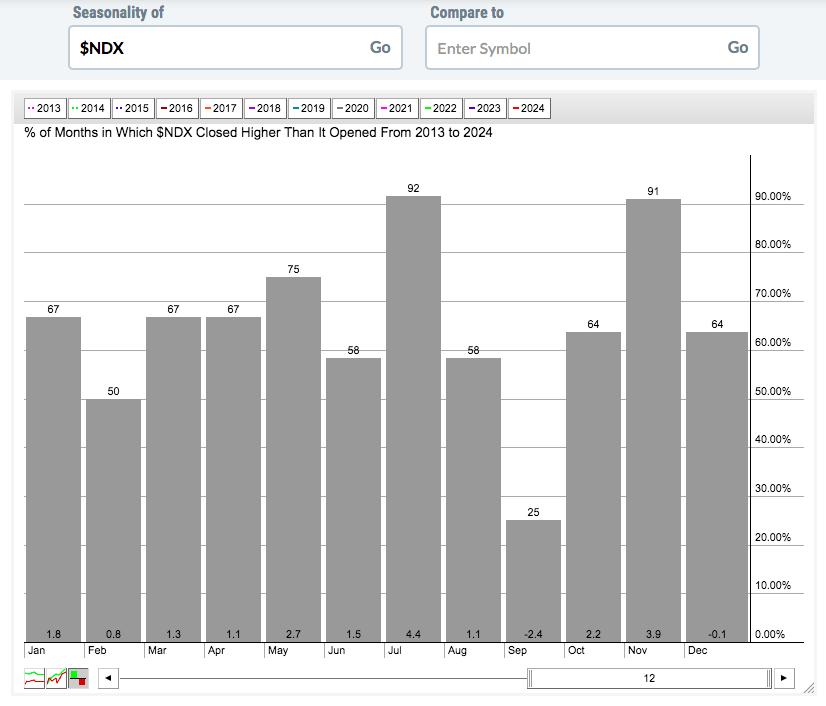
Look at those average monthly returns for each calendar month over the past 12 years – since the secular bull market began in 2013. 9 of the 12 calendar months average double digits gains, with July (+4.4%), November (+3.9%), and May (+2.7%) topping the list. December (-0.1%) is the only other month showing a negative average return, though it’s essentially breakeven. That leaves September, which has averaged moving lower by 2.4% over the past 12 years, as the worst performer among all calendar months.
As August ends, it reminds me of Metallica’s hit, “Enter Sandman”. Remember the line, “exit light, enter night”? August is the light (at least on a relative basis) and September is the night. As soon as the calendar flipped, sellers appeared and were ready to rumble. Thus far, the bulls haven’t put up much of a fight.
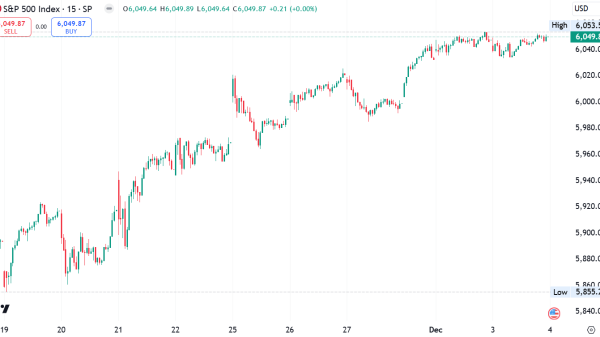
There is a silver lining, however. We just need to escape September first. Here’s a seasonality chart of the S&P 500:
This covers the past 12 years, or the entirety of the current secular bull market, which, in my opinion, began the day that the S&P 500 cleared its 2000 and 2007 tops. That was on April 10, 2013 and the S&P 500 never looked back. Study those average monthly returns. You can clearly see a significant drop off in August and especially September, right? Then, like a water faucet being turned from cold to hot, the market heats up big time in Q4. By simply adding the monthly returns in each calendar quarter, you can see the following historical performance of the S&P 500 by calendar quarter:
Q1 (January, February, March): +2.2%Q2 (April, May, June): +3.4%Q3 (July, August, September): +1.2%Q4 (October, November, December): +5.9%
Does this guarantee us excellent market returns in Q4 2024? Of course not. But it is ONE bullish historical signal that you should be aware of, especially if we begin to see bottoming signs form technically. The absolute BEST period of the year to be invested in the S&P 500 from a long perspective is from the October 27th close through the following January 18th close. The S&P 500 has ended that period higher that it began in each of the last 7 years and in 14 of the last 15 years. And if we stretch it further, that upcoming period has risen 38 of the last 41 years. It’s not a slam dunk, but the odds of the period ending higher sure do favor the bulls by a WIDE margin.
Let me add to this bullish history with one more fact. Since 1982, this October 27th close to January 18th close has seen the S&P 500 climb more than 10% 8 times, more than 9% 12 times, and more than 8% 16 times! Yet we’ve only seen 3 declines over that same period. The % lost in those 3 years are 8.98% (2016), 13.68% (2008), and 2.29% (2001). I’ll take my bullish chances when the September/October low forms.
I talked about potential levels on the S&P 500 when it finally reaches bottom over the next handful of weeks. My weekly market recap video for the week ended September 6th, “Where Is The Likely S&P 500 Bottom?”, is ready for your viewing pleasure. Please “Like” the video and “Subscribe” to our channel, if you haven’t already. Feel free to leave me a comment with your thoughts on the S&P 500 as well.
Also, on Monday, I’ll be breaking down a chart that looks like it is heading lower in a big, big way in our FREE EB Digest newsletter. If you’d like to see the article and you’re not already a free subscriber, CLICK HERE to register. There is no credit card required and you may unsubscribe at any time.
Happy trading!
Tom