


While the S&P 500 did manage to finish the week above tactical support at 5250, one of the most widely-followed macro technical indicators recently registered an initial sell signal for the second time in 2024. Today we’ll explain the three components of the Hindenburg Omen, show why this pattern is common at major market tops, and discuss the additional signals we’d need to observe to confirm a bearish outlook for the S&P 500 using this powerful indicator.
The Hindenburg Omen was created and popularized by market strategist Jim Miekka, and is based on three factors that he discovered were quite common at major market tops. It’s worth noting that a number of different versions of the Hindenburg Omen are used in the present day; here, we’re describing the version used on StockCharts.com.
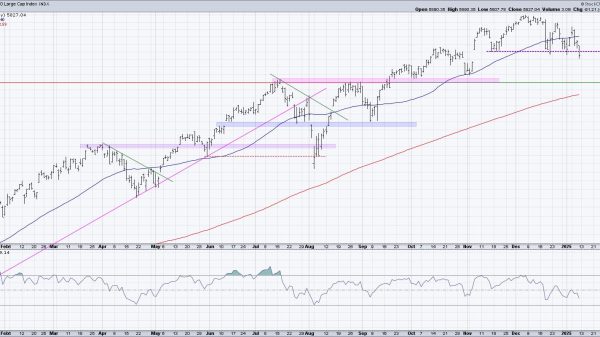
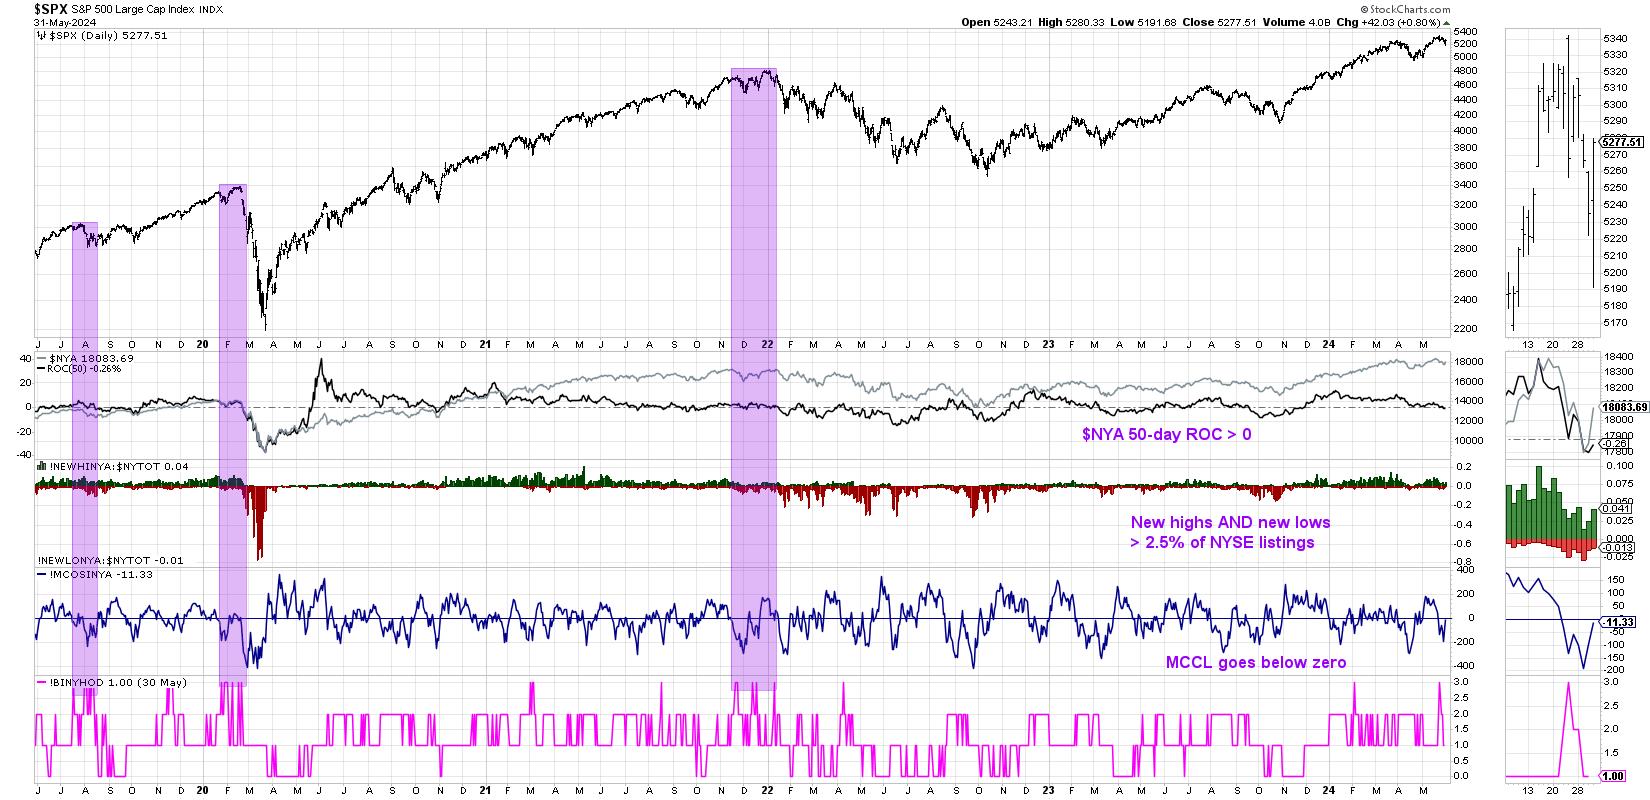
First, the NYSE Composite Index ($NYA) needs to be in an uptrend. In this case, we want to see the 50-day rate-of-change to be greater than zero. This is an important first step, because we’re only looking for a potential market top if the market is already in an established uptrend!
The 50-day ROC for the NYSE Composite Index turned positive in November 2023, soon after the October 2023 market low. This rate-of-change has remained above zero until just this week.
Second, there needs to be at least 2.5% of NYSE members making new 52-week highs and at least 2.5% of NYSE members making new 52-week lows on the same day. You may initial think that an extreme number of new highs would suffice, as that would imply some sort of “overbought” market condition. Or perhaps an expansion in new lows would make sense, because then the market would have moved higher with weaker breadth conditions.
But Miekka’s analysis showed that market tops are usually marked by indecision, and, by looking for a situation where there are a healthy number of both new 52-week highs and new 52-week lows, we can confirm this unstable market state. We can see in the chart that we saw 2.5% of new highs and new lows on the same day earlier in the month of May.
One quick note: this is where different charting providers have used different settings for the Hindenburg Omen, ranging from 2.2% to 2.8% of NYSE listings as the threshold for this second factor.
Finally, the McClellan Oscillator needs to turn negative, that is, break below the zero level. This tactical market breadth indicator is based on the cumulative advance-decline line, and a break below zero represents a short-term bearish rotation in breadth conditions.
I’ve color-coded this chart green to highlight positive breadth and red for negative breadth conditions over the past 12 months. Note how we recently rotated back below the zero level, providing the final piece of evidence for an initial reading on the Hindenburg Omen.
So what would make this a complete and confirmed Hindenburg Omen, similar to what we’ve seen a previous major market tops? It’s important to observe a second signal within one month of trading, as Miekka found that multiple signals in a relatively short period of time tended to further validate the indicator.
Here, I’ve isolated a “composite” indicator that tracks the three components outlined above. When all three are firing, the indicator reads +3.0. You’ll notice the signal from last week, as well as the previous signal from February 2024. Note that we never received that second confirmatory signal in February, so the Hindenburg Omen was never confirmed.
When was the last time we had a valid and confirmed Hindenburg Omen? In December 2021, just before the January 2022 market top, we experienced two sets of confirmed factors within one month. Before that, the next previous signal was during the COVID peak in February 2020!
So while this initial reading from last week does not fully confirm a Hindenburg Omen top, it should alert investors to be ready for the downside that often comes after a confirmed sell signal. And while the indicator does not necessarily imply potential downside targets, a brief history lesson of the S&P 500 shows the previous signals have often preceded major market declines!
RR#6,
Dave
P.S. Ready to upgrade your investment process? Check out my free behavioral investing course!
David Keller, CMT
Chief Market Strategist
StockCharts.com
Disclaimer: This blog is for educational purposes only and should not be construed as financial advice. The ideas and strategies should never be used without first assessing your own personal and financial situation, or without consulting a financial professional.
The author does not have a position in mentioned securities at the time of publication. Any opinions expressed herein are solely those of the author and do not in any way represent the views or opinions of any other person or entity.