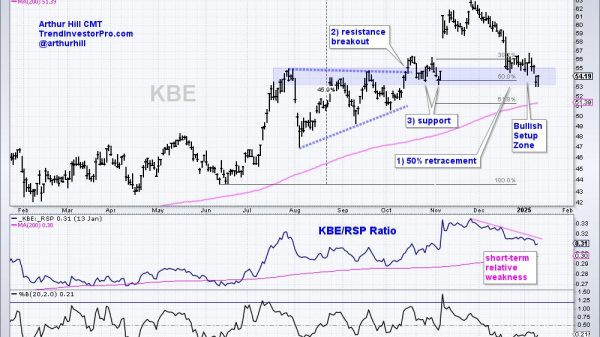
Exhaustion Gap: Practical Applications in Technical Analysis
An exhaustion gap is a key concept in technical analysis, often signaling the end of a price trend. Understanding and applying this concept can greatly benefit traders who aim to capitalize on or protect against potential reversals in market momentum.
To make a long story short, this article explores the practical applications of exhaustion gaps, including how to spot them, their implications, and strategic responses.
What is an exhaustion gap?
It occurs when the price of a security makes a sharp move, usually on high volume, after a long trend but then fails to continue moving in that direction. This suggests that the trend may be losing energy.
This type of gap can appear in both upward and downward trends and is typically marked by a significant increase in trading volume. This surge in volume reflects the last push of buying or selling before market participants start to pull back or exit their positions.
Identifying exhaustion gaps
Spotting an exhaustion gap involves looking for several key indicators:
Trend precedence: An exhaustion gap follows an extended move in price, which can be either up (bullish) or down (bearish).
Volume spike: There should be a noticeable increase in trading volume on the day the gap occurs, which suggests a peak in buying or selling activity.
Price behaviour: After the gap, prices often stall or reverse. For example, in an uptrend, the price might fail to reach higher highs, or in a downtrend, it might not hit lower lows.
Sentiment indicators: Tools like the Relative Strength Index (RSI) or the Stochastic Oscillator can indicate overbought or oversold conditions, supporting the idea that the trend may be about to exhaust.
Practical applications in trading
Trend reversal confirmation
A primary use of an exhaustion gap is to confirm a possible trend reversal. Traders may look for additional signals, such as candlestick patterns (like a bearish engulfing pattern after an upward exhaustion gap or a bullish engulfing pattern after a downward gap). These confirmations help strengthen the reliability of the initial gap signal.
Setting stop-loss orders
Identifying a gap allows traders to set strategic stop-loss orders effectively. For instance, if a trader is in a long position and an upward gap appears, placing a stop-loss just below the gap can prevent significant losses if the price reverses.
Entry points for contrarian strategies
Contrarian traders, who prefer to bet against the prevailing market trends, can use exhaustion gaps as cues for entering trades. For example, after spotting an upward gap, a contrarian might take a short position, anticipating a price drop.
Risk management
Understanding exhaustion gaps can significantly improve risk management. Recognizing these patterns helps traders adjust their exposure and hedge existing positions to accommodate potential volatility or price reversals.
Topics to consider
While exhaustion gaps can be powerful indicators, they have their limitations and require careful consideration:
False signals: Not every gap that looks like an exhaustion gap results in a trend reversal. Sometimes, a gap represents a temporary pause before the trend continues.
Market conditions: Exhaustion gaps are more reliable in markets with high trading volumes. In markets with low liquidity, gaps may not reflect broader market sentiment.
Confirmation necessity: It’s crucial to wait for confirmation through other technical indicators or patterns before acting on a signal from an exhaustion gap.
Understanding different types of gaps in technical analysis—like exhaustion, breakaway, and runaway—can really help traders get a grip on what’s likely to happen next in the markets. Here’s an easier explanation of these gaps and how they differ.
Exhaustion gap vs. breakaway gap
This gap shows up after a price has been moving in one direction for a while and signals that the trend is about to end. It appears as a sudden jump in price at the peak of the trend, usually with lots of trading happening. After this gap, prices tend to either reverse or stop advancing, showing that the momentum is fading.
Breakaway gap: This gap occurs at the beginning of a new trend or when prices break out from a stagnant phase (like when they’ve been flat for a while). It shows a strong burst of buying or selling that pushes the price out of its old range, indicating the start of a strong move in the new direction, backed by high trading volume.
Runaway gap vs. exhaustion gap
Runaway gap (continuation gap): Found within an ongoing trend, runaway gaps suggest that the trend is not only continuing but might even strengthen. These gaps typically pop up in the middle of a market move and are marked by an increase in trading volume.
On the other hand, the exhaustion gap appears at the height of a trend and is the last hurrah before the trend starts to reverse or slow down. It’s a sign that the trend is running out of steam and might switch direction soon.
By knowing these differences, traders can better predict where the market is headed and adjust their strategies, whether they’re getting ready for new trends with breakaway gaps, confirming the trend will keep going with runaway gaps, or bracing for a turnaround with exhaustion gaps.
In conclusion, the exhaustion gap is a powerful tool in technical analysis, offering insights into potential trend reversals and aiding in effective risk management. Traders should integrate exhaustion gap identification with other technical indicators and robust risk management practices.
Nevertheless, like any trading strategy, caution is advised, and strategies should be thoroughly tested in different market environments to confirm their effectiveness and adaptability.
The post Exhaustion Gap: Practical Applications in Technical Analysis appeared first on FinanceBrokerage.

