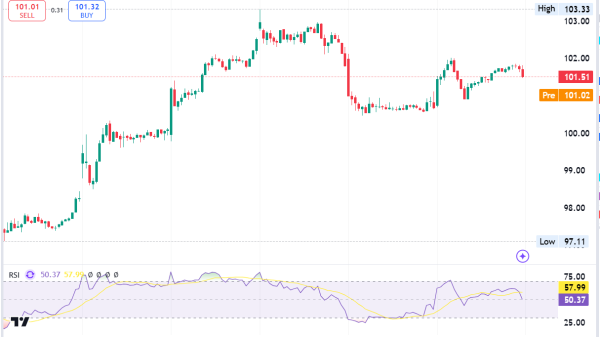


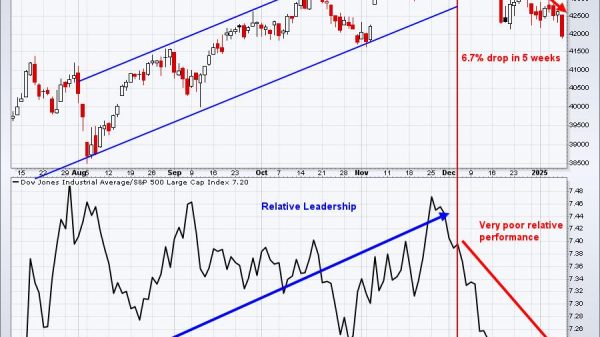
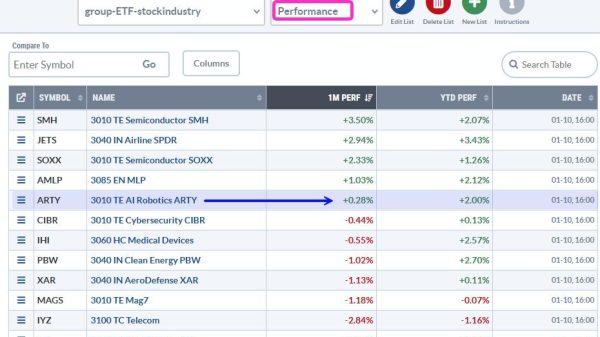


Gold is not the most exciting asset at the moment, but it is in a long-term uptrend and perhaps the strongest commodity out there. There are also signs that the January decline is ending as RSI hits a momentum support zone and a bullish continuation pattern forms. Note that GLD was first highlighted in our Chart Trader report/video on Tuesday, 30-January.
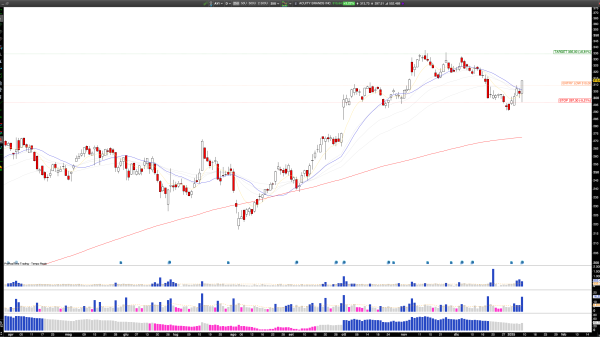
The first chart shows the Gold SPDR (GLD) since October 2022, when it was trading around $150. GLD advanced to the 190 area by May 2023 and then corrected into early October. I am calling this a correction because a large falling channel formed (blue lines) and the decline retraced 50-61.8 percent of the prior advance. GLD broke out of the channel in mid October and hit a new high in late December.
The indicator window shows the Trend Composite turning bullish on October 26th (green arrow), which is about a week after the channel breakout. This indicator aggregate signals in five trend-following indicators. It started at +1, moved to +3 and is currently at +5. This means all five inputs are in bull mode. The Trend Composite and 10 other indicators are part of the TIP Indicator Edge Plugin for StockCharts ACP (here).
The next chart shows GLD correcting after hitting a new high. GLD hit a new high in late December and then fell back in January. This decline formed a falling channel and retraced around 2/3 of the December advance. GLD is making waves with bounce and breakout the last two days. The green line at 186 marks re-evaluation support.
The indicator window shows RSI(14) exceeding 70 in October, late November and early December. This shows strong upside momentum during the fourth quarter advance. RSI fell back to the 40-50 zone in mid November, mid December and mid January (green shading). This area acts as momentum support in an uptrend. There are signs that RSI is turning up from this area and improving momentum supports the channel breakout.
The Chart Trader offering at TrendInvestorPro provides broad market analysis and carefully curated trading setups for stocks and ETFs. We focus on bullish continuation patterns, such as the one in GLD. Reports are published every Tuesday and Thursday before the open and each report includes a video. Click here to learn more.
///////////////////////////////////