


When you get notification of the following two alerts, it’s clear that today was technology’s day.
Technology Sector Bullish Percent Index crosses above 70
Nasdaq crosses above 15000
Note: Here’s how you can access predefined technical alerts.
Select the Charts & Tools tab
Locate the Predefined Technical Alerts card
Select View Latest Alerts
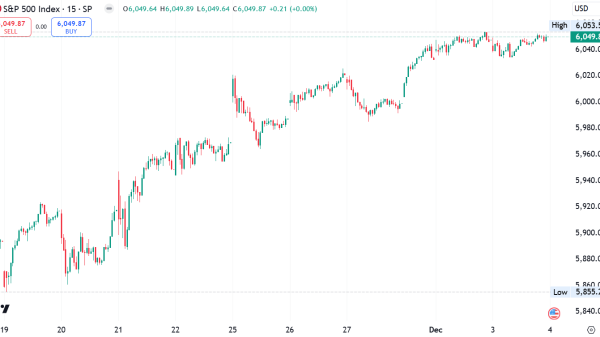
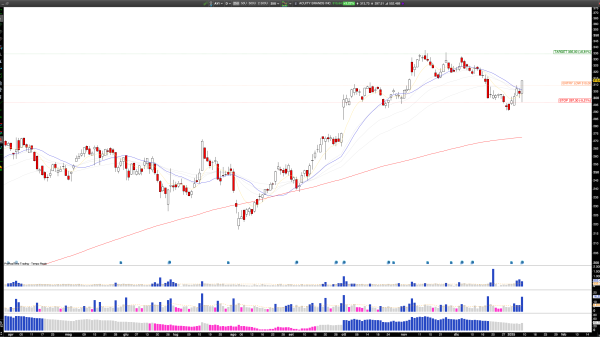
An upgrade for Apple (AAPL) and a better-than-expected earnings report from Taiwan Semiconductor (TSM) boosted the Technology sector. The Nasdaq Composite ($COMPQ) ended the trading day up 1.35%. The index is trading above its 21-day exponential moving average and is close to its 52-week high (see chart below).
CHART 1. NASDAQ COMPOSITE RISES AND APPROACHES ITS 52-WEEK HIGH. The Nasdaq showed signs of life with a big boost from semiconductor stocks. How much higher can it go?Chart source: StockCharts.com. For educational purposes.
When an index, stock, or exchange-traded fund (ETF) comes close to its yearly high, one of the biggest fears investors have is that it’s getting toppy. It’s a valid concern; after all, how many times have you purchased a stock only to see it drop?
Looking Under the Hood
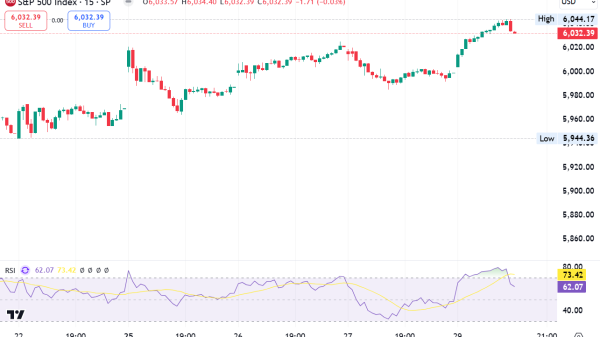
It helps to look at market breadth to determine what’s happening beneath the surface. One popular breadth indicator is the Advance-Decline indicator. In the chart below, you can see the daily chart of the Nasdaq Composite, with the Nasdaq Advance-Decline Issues ($NAAD) indicator behind the price chart.
StockCharts Tip: Add this indicator to your chart by selecting Price from the Indicator dropdown menu and adding $NAAD in the Parameters box.
CHART 2. NASDAQ COMPOSITE RISES WHILE ADVANCE-DECLINE ISSUES MOVE LOWER. The divergence between the two could be a bearish signal, especially if the number of advancing issues continues to decline.Chart source: StockCharts.com. For educational purposes.
A point to note is that there is a divergence between the index and the indicator—the Nasdaq Composite is rising while the Nasdaq Advance-Decline Issues is declining. This doesn’t necessarily mean the index will see a massive decline soon; remember, the Technology Sector Bullish Percent Index just crossed above 70. It just means that indicators that suggest bearish sentiment need to reverse in a positive direction so you can be more confident about opening long positions.
StockCharts contains a massive collection of Market Breadth indicators, such as the McClellan Oscillator, DecisionPoint Breadth and Volume Momentum Oscillator, Net New 52-Week Highs, and Percent Above Moving Average, among others.
In the weekly chart of $COMPQ below, the Nasdaq Percent of Stocks Above 200-Day Moving Average ($NAA200R) has been added in the lower panel. That shows that 44.76% of Nasdaq stocks are above their 200-day moving average. On a day when the Nasdaq closed 1.35% higher, it would have been more bullish if the percentage was higher.
StockCharts Tip: Add this indicator to your chart by selecting Price from the Indicator dropdown menu and adding $NAA200R in the Parameters box.
CHART 3. WATCH MARKET BREADTH. The Percentage of Nasdaq stocks trading above their 200-day moving average started declining in February 2021, while the Nasdaq Composite continued making higher highs. It was only in early 2022 that the Nasdaq started declining. The difference this time is that the percentage of stocks trading above their 200-day moving average is lower.Chart source: StockCharts.com. For educational purposes.
What’s more interesting on the weekly chart is that while the Nasdaq rose in 2021, the percentage of stocks trading above the 200-day moving average declined. This was an early indication that selling pressure may come into play, but it took almost a year before the Nasdaq started its downtrend. The difference is the percentage was at around 80% in early 2021.
The Bottom Line
If you’re in a situation where the market looks toppy, and the overall sentiment is uncertain, it helps to look at the market’s internals. Make sure to identify if there’s more buying or selling pressure. If the buying pressure strengthens as the market ascends, there’s a greater chance of continuation. If there’s more selling pressure as the market increases, there’s a greater chance of a pullback. Trading is all about probabilities, and you’re looking for scenarios that have a higher probability of occurring.
So, if you’re considering owning some technology stocks, it may be better to wait for the breadth indicators to turn upward and show some follow-through before hitting that buy button.
Disclaimer: This blog is for educational purposes only and should not be construed as financial advice. The ideas and strategies should never be used without first assessing your own personal and financial situation, or without consulting a financial professional.