What a week the market had!
At the start, things looked positive for the S&P 500 index ($SPX). The index finally broke above the 4200 level, the debt ceiling issue was resolved, and the probability of a Fed interest rate pause was relatively high.
But on Wednesday, things changed. Canada and Australia raised their benchmark interest rates, which may have spooked investors. Treasury yields rose, and US equities turned lower the day after the S&P 500 had closed at its 10-month high and Nasdaq Composite at its 14-month high. The probability of a Fed rate hike, according to the CME FedWatch Tool, rose from around 25% to 36%.
Investors fled to small-cap stocks. All of a sudden, the large-cap growth stocks that were in the spotlight for the last few weeks—thanks to the AI buzz, Apple’s unveiling of its Vision Pro headset, a Goldilocks jobs report—were selling off.
But things were different on Thursday. The S&P was back in bull market territory, the probability of a Fed interest rate pause was above 70%, and recession worries were a distant memory. Does that mean the bear market is over? It’s worth looking at the chart of the S&P 500 to get a closer look.
S&P 500 Technical Outlook
Since April, the S&P 500 index has been moving in a slightly upward channel (see daily chart below). On June 2, the index broke above the 4200 level and the top level of the upward-sloping channel.
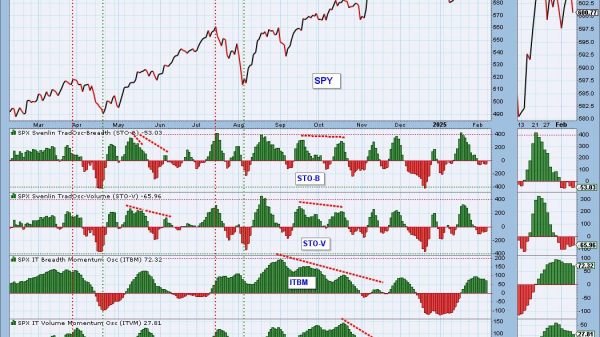
CHART 1: S&P IN BULL MARKET TERRITORY. Will the breadth indicators support the up move?Chart source: StockCharts.com (click chart for live version). For educational purposes only.
The index is trading close to its 52-week high, above its 50-, 100-, and 200-day moving averages and market breadth shows that participation in the uptrend is moving higher.
The percent of S&P 500 stocks above their 200-day moving average (panel below price chart) is moving higher. The indicator has broken above its 20-day moving average, although it would be more confirming if the moving average trended higher.
The S&P 500 Advance-Decline Percent, which measures the percentage of net advances, is displayed in the middle panel. The indicator shows a decline in the percentage of S&P 500 stocks participating in the advance.
Switching gears to sentiment, if you look at Consumer Discretionary versus Consumer Staples, Consumer Discretionary is advancing. This suggests that consumers are gravitating towards an offensive strategy, rather than a defensive one.
So the daily chart is giving mixed signals. To clear things up, it may help to get a longer-term perspective by turning to the weekly chart. If you bring up a five-year weekly chart of the S&P 500 index (see below), it’s interesting to see how the index bounced off its 200-week moving average in October 2022 and has been in a gradual uptrend.
CHART 2: WEEKLY CHART OF S&P 500. The index has broken above a consolidation pattern, which could indicate more upside.Chart source: StockCharts.com (click chart for live version). For educational purposes only.
The index has broken above a triangle pattern and, if it continues in this direction, the S&P 500 could move toward its January 2022 high. If that’s the case, the bear market may be over!
But it’s unclear if we’re out of the woods yet. Economic data indicates that inflation is still in play and the labor market is tight. We’ll be getting more data next week ahead of the Fed meeting. If Chairman Powell suggests that past interest rate hikes have had an impact and conditions are status quo, then there’s a strong chance that the market will continue higher.
Final Thoughts
One thing that’s sure is investor sentiment can flip on a dime. As of now, the S&P 500 is still trending higher. But if it breaks to the downside of either the weekly chart’s consolidation pattern or below the daily channel, you may want to adjust your portfolio holdings to sync with the market. Keep an eye on the Sector Summary and Market Summary pages on your StockCharts platform.
End of Week Wrap Up
Dow, S&P 500, Nasdaq up; volatility down
Friday’s close: $SPX up 0.16%% at 4298.86.xx, $INDU up 0.13% at 33,876.78; $COMPQ up 0.16% at 13259.14
$VIX closed at 13.85
Best performing sector for the week: Consumer Discretionary
Worst performing sector for the week: Consumer staples
Top 5 Large Cap SCTR stocks (Friday’s close): Samsara Inc. (IOT); NVIDIA Corp. (NVDA); Palantir Technologies, Inc. (PLTR); MongoDB, Inc. (MDB); Meta Platforms, Inc. (META)
On the Radar Next Week
May Consumer Price Index
May Producer Price Index
Federal Reserve Interest-rate statement and presser
US retail sales
Consumer sentiment
Disclaimer: This blog is for educational purposes only and should not be construed as financial advice. The ideas and strategies should never be used without first assessing your own personal and financial situation, or without consulting a financial professional.


